
Ofgem’s RIIO-ED3 SSMD: what next for GB electricity distribution networks
On 21 May 2026, Ofgem published its Sector Specific Methodology Decision (SSMD)1 for the forthcoming RIIO-ED3 (ED3) price control for GB electricity distribution network operators (DNOs). We explore some of the key themes in the Decision, ahead of the upcoming business planning period and the expected publication of the draft determinations (DD) next summer.
The current price control for the electricity distribution sector (ED2) is due to end in March 2028, with the ED3 regulatory period starting on 1 April 2028 and running for the five years up to 31 March 2033.2 Prior to this SSMD, Ofgem published its Sector Specific Methodology Consultation (SSMC) in October Did, setting out its initial view of the regulatory framework for the upcoming ED3 price control.3
A core feature of the ED3 SSMD is the role assigned to the National Energy System Operator’s (NESO) transitional Regional Energy Strategic Plans (tRESPs) as a common planning input for all DNOs. Published in January 2026, the tRESPs set out regional demand growth pathways consistent with national decarbonisation objectives, providing—for the first time in distributed regulation—a consistent exogenous reference for network investment planning and cross-sector cost benchmarking.
Each DNO’s application of the tRESP will be subject to independent assurance by the NESO, running in parallel with Ofgem’s business plan assessment from December 2026. This external check, which was absent at all prior distribution price controls, reflects Ofgem’s intention to ensure a consistent application across the sector. The tRESP should provide a sufficiently consistent planning baseline, reducing the spread in forecast investment across business plans. In principle, this should eliminate the need for post-modelling adjustments for ED3—a departure from ED2, where a fairly complex demand-driven post-modelling adjustment was applied to account for differences in forecast load-related investment across DNOs. However, Ofgem explicitly acknowledges that, if business plan data reveals material inconsistencies despite the tRESP, a post-modelling adjustment may need to be reconsidered.
The scale of anticipated investment nonetheless comes with uncertainty. While electrification of heat, transport and industry is expected to drive material demand growth, Ofgem acknowledges that the pace and location of that growth remain uncertain in the near to medium term—with the uptake of low-carbon technologies (LCTs), particularly
heat pumps, progressing more slowly than initial projections. This shapes the cost assessment challenge: allowances must be proportionate to evidenced need while retaining the capacity to adapt as the evidence base develops.
Flexibility
One of the most significant developments in the SSMD—and a material evolution from the SSMC—is Ofgem’s decision to place a mandatory ‘Build and Flex’ strategy at the centre of each DNO’s business plan. While the SSMC had signalled a more plan-led, proactive approach oriented towards building capacity ahead of tRESP-projected demand, the SSMD arrives at a different position, explicitly acknowledging that Ofgem no longer considers it right to fully fund load-related plans upfront, given uncertainty over the pace and location of future electricity demand.
The SSMD states that DNOs will be required to systematically assess flexibility and other alternatives before committing to physical reinforcement. Flexibility is thereby elevated from a secondary consideration that DNOs could choose to take up voluntarily to a first-stage obligation in the optioneering process. Planned use of flexibility in ED3 is expected to represent an increase relative to previous price controls.
Ofgem expects this strategy to inform not only the upfront business plan but also in-period decision-making throughout ED3—including how DNOs use flexibility to manage outages, support timely connections, reduce curtailment, and optimise delivery alongside targeted reinforcement.
Flexibility is to be explicitly funded through distinct allowances, separate from network-building funding—a structural change from ED2, where DNOs could substitute reinforcement with flexibility via a TOTEX Incentive Mechanism (TIM) in ED3. This closes the principal route by which ED3 DNOs could benefit from substituting planned reinforcement with lower-cost flexible solutions.
Ofgem continues to explore whether allowances and controls could ultimately be combined within a single accountability mechanism covering reinforcement, flexibility and innovative solutions, although it acknowledges that no sufficiently developed output metric yet exists.
The resulting framework asks DNOs to strike a careful balance: demonstrating that flexibility has been systematically considered, while retaining the capacity to commit to reinforcement with sufficient lead times to avoid consumer detriment. Given the novelty of a mandatory Build and Flex strategy in the ED3 framework, the precise boundaries of this balance, namely what constitutes low-regret investment and how flexibility deployment interacts with the output delivery mechanism, will require further engagement between Ofgem and DNOs.
In addition, how a DNO’s deployment of flexibility in place of planned reinforcement is treated under the output delivery mechanism remains uncertain at this stage. Specifically, if a DNO deploys flexibility instead of planned reinforcement, it is unclear whether this would count as having delivered the required output (attracting no revenue adjustment) or register as a shortfall against the delivery target, triggering a revenue adjustment.
Efficiency and cost assessment
As DNOs face an unprecedented investment challenge driven by the electrification of heat, transport and industry in the context of net zero, expenditure needs are expected to be significantly higher in ED3 than in ED2. At the same time, companies tend to optimise their solutions to keep costs and operations manageable, while Ofgem must ensure that consumers pay only for costs that are efficient. As such, the scrutiny applied to the models and methodologies used to determine efficient cost allowances is typically deep and extensive.
Building on the SSMC, and after considering stakeholder feedback and further engagement with DNOs, the SSMD sets out Ofgem’s ED3 cost assessment toolkit and underlying methodologies in greater detail. While uncertainty remains in certain aspects of the framework—which Ofgem intends to develop further following the submission of DNO business plan data—the SSMD provides greater clarity in a number of areas.
TOTEX, disaggregated and mid-level models
An important part of cost assessment will continue to be the TOTEX modelling approach. Ofgem has confirmed the use of TOTEX models and will be employing the same high-level principles established at the SSMC; in terms of the cost drivers, they must make economic and engineering sense, be accurately and consistently measurable, have a fairly stable relationship with costs over time, and be beyond the control of the network company.
While the TOTEX framework is retained at a high level, the SSMD signals two important changes relative to ED2. First, the SSMD points towards a tighter link between modelled cost pools and the allocation of efficient cost allowances, thereby reducing the scope for cross-subsidisation between cost categories. Second, Ofgem signals its intention to explore the application of workload adjustments within TOTEX models themselves (not solely within disaggregate models as at ED2) in order to ensure a broader and more consistent incorporation of engineering assessments of workload activities.
In addition to TOTEX models, Ofgem confirms that the development of mid-level models will continue, but makes no commitment that these models will be used to determine allowances. Ofgem identifies three potential roles for mid-level models: validating and testing the top-down TOTEX and disaggregated models; contributing to the calculation of efficient allowances alongside these models; or replacing (essentially, aggregating) elements of the disaggregated suite.
Reflecting uncertainty around the role of mid-level models, the SSMD is less prescriptive than the SSMC on model weightings, stating that final weights across the modelling suites will depend on the assessed quality and robustness of each modelling approach within the wider ED3 framework.
The SSMD largely rules out the use of implicit allowances explored at SSMC,4 indicating that ED3 allocations are more likely to rely on submitted cost shares and/or cost shares derived from disaggregated model allowances. Ofgem intends to reserve its final decision for DDs.
Cost drivers
In the SSMC, Ofgem proposed a longlist of cost drivers for the suggested models. All drivers proposed at SSMC remain in scope, supplemented by some additional drivers proposed by DNOs in their consultation responses (see Table 1 below).
Table 1 Longlist of cost drivers considered for ED3

Source: Ofgem (2026), ‘ED3 Sector Specific Methodology Decision – Cost assessment Annex’, 21 May, para. 3.44.
The SSMD has not discounted any of the cost drivers outlined at this stage, citing the absence of reliable ED3 data as a reason. Ofgem intends to refine the selection of the cost drivers ahead of DDs once the business plan data becomes available to enable empirical analysis.
The SSMD confirms that Ofgem is likely to retain composite scale variables (CSVs) as key cost drivers in ED3 and continue considering both bottom-up and top-down approaches to their construction, consistent with ED2. The SSMD notes that Ofgem will review several key design questions ahead of DDs, such as the cost driver mapping, the approach to weightings, and the treatment of standardisations and normalisations.
The CSV construction has become contentious in GD3, where Ofgem has adopted a single top-down CSV and one company has appealed to the Competition and Markets Authority (CMA) in favour of a bottom-up approach;5 the CMA’s September 2026 ruling could therefore influence Ofgem’s stance at ED3.
Catch-up efficiency challenge
In light of the increasing load-related expenditure investment in ED3, DNOs have raised concerns about stringent efficiency benchmarks, with no decision having yet been taken at SSMD on the catch-up efficiency challenge. The ED2 glide path (75th to 85th percentile over three years) remains the starting point, and Ofgem will reassess whether the 85th percentile remains appropriate for ED3 given its scale and novelty, although the SSMD presents more insight than the SSMC into the regulator’s considerations.
Ongoing efficiency
At this stage, Ofgem has not made any further changes on ongoing efficiency (OE), deferring decisions on datasets, accounting metrics, time periods and comparators to the DDs, following business plan submissions.
While networks argue that ED3 differs materially from past price controls due to expansion pressures and supply chain constraints—raising questions about reliance on historical data, including from before the global financial crisis (GFC)—Ofgem acknowledges this shift but has retained the SSMC methodology without specifying the underlying parameters.
Similarly, Ofgem has not yet resolved debates on the use of regulatory precedents or historical innovation funding, noting that further analysis is required.
The ongoing GD3 CMA appeal on the 1% OE parameter, while in a different sector, is also relevant to ED3 given its methodological similarity, particularly regarding the weighting of historical data, comparator periods and qualitative adjustments, all of which remain open at the SSMD stage.
Real price effects
In its SSMD, Ofgem confirms the same policy decision on real price effects (RPEs) as outlined in its SSMC.
Specifically, Ofgem proposes to continue indexing baseline cost allowances to CPIH, in combination with an in-period true-up mechanism to reconcile forecast and outturn movements in selected input price indices. Ofgem also re-iterates its view that any changes to the approach to RPE indexation should balance risk appropriately between DNOs and consumers without undermining efficiency incentives or materially increasing complexity.
Nevertheless, Ofgem has indicated that it remains open to considering options that improve on the existing approach. This includes reviewing the indices and weights used in the mechanism, as well as changes to deal with the persistence of shocks and approaches to managing volatility.
The exact form of the cost assessment framework and many of its underpinning components remains open at this stage. However, with draft business plan data expected in July 2026, the detailed development of cost assessment models is expected to ramp up thereafter across numerous areas of the cost assessment toolkit for ED3, including narrowing the longlist of cost drivers, clarifying the exact role of mid-level models relative to disaggregated models, the design of the modelling pools and their relative weighting, and determining the appropriate level of the catch-up efficiency challenge.
While the CMA recently decided to reduce Ofwat’s PR24 OE target from 1% to 0.7%, the GD3 energy appeals on this issue are still ongoing and it is likely that ED3 will build on the CMA’s final decision, expected in September.
Incentives and price control deliverables
In its SSMC, Ofgem proposed a variety of changes to the definition of performance metrics and how these should be incentivised (through output delivery incentives, or ODIs). Ofgem has now reached decisions on these designs.
Incentives
Table 2 overleaf provides a summary of the key decisions on ODIs relative to ED2.
Table 2 Ofgem decisions on ODIs
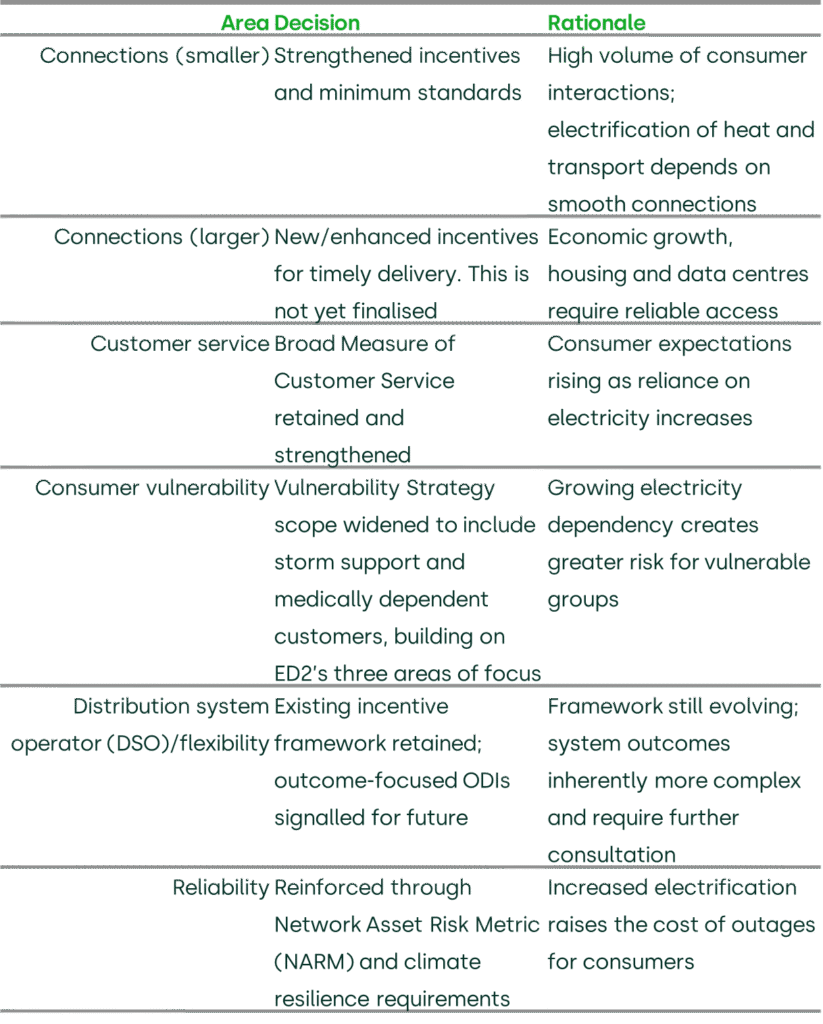
Reforming connections incentives was a major theme at SSMC. The current system (based on a distinction between ‘major’ and ‘minor’ connections, with incentives) was deemed to be outdated, given the rapid movement towards electrification and LCTs.
At SSMD, Ofgem has decided on a split between ‘larger’ connections (e.g. housing developments and data centres) and ‘smaller’ connections (e.g. new properties, electric vehicle charge points and heat pumps), with tailored incentive packages for each.
Another key incentive area is customer vulnerability. In the SSMC Ofgem highlighted that the package of measures adopted in ED2 was centred on the Consumer Vulnerability Incentive (CVI), whereby DNOs face rewards or penalties based on performance—as measured by Priority Services Register (PSR) Reach, and Social Value (fuel poverty and low-carbon transition). With growing reliance on electricity for heating and transport, at SSMD Ofgem has strengthened its commitment to vulnerable consumers.
Finally, at SSMC Ofgem indicated that it was minded to retain the existing Interruptions Incentive Scheme (IIS) financial ODI-F. This scores companies according to Customer Interruptions (CIs) and Customer Minutes Lost
(CML). However, it was noted that averaging CI and CML across a DNO’s licence area can obscure the impact on customers who face long or repeated unplanned interruptions (albeit that there is an existing Worst-Served Customer provision). In addition, the IIS does not incentivise a reduction in the frequency of short interruptions, as these are excluded from the incentive. Ofgem recognises that further work is required, and will work collaboratively with stakeholders to shape the proposals.
Business planning incentive and TOTEX incentive mechanism
Generally, Ofgem has decided to retain much of the rationale and proposed mechanisms that were set out in the SSMC for the business plan incentive (BPI) and the TIM.
For the BPI mechanism, the three-stage framework has been carried forward from the SSMC but Ofgem has indicated that the incentive will be strengthened and linked closer to delivery. This is to encourage more ambitious plans of a higher quality for ED3, given the scale and pace of change expected. Rewards and penalties are calculated against the equity portion of the RAV as in the gas distribution and gas and electricity transmission RIIO-3 (GD&T3) price controls, and unlike in ED2, where they were calculated against allowed TOTEX.
The three stages of the BPI are as follows.
- Penalty-only assessment around minimum requirements. Failure to submit the minimum requirements may result in a penalty of up to 20bps return on regulated equity (RoRE). Unlike the RIIO-GD&T3 BPI, a failure of any single minimum requirement will not necessarily trigger the full penalty.
- Rewards for efficient and justified cost proposals, with incentives capped at 40bps RoRE. Deviating from the approach taken for GD&T3, the penalty element will be removed from the cost efficiency part of the incentive, as Ofgem considered it overly punitive. This represents a stronger reward than at the SSMC, following the industry’s concerns about adverse efficiency incentives through Ofgem’s ratchet mechanism.6
- Rewards for high-quality early proposals for new commitments, incentives or other mechanisms capped at 20bps RoRE. Ofgem has indicated that 21 out of 35 submitted proposals broadly align with the ED3 objectives, but no decision will be made on these until the final determinations (FDs).
Ofgem has confirmed that it will set limits on the application of the TIM to capital allowances that fall outside of PCD-governed categories, with those limits set at an aggregate cost category level rather than placing tight restrictions around individual sub-cost categories. This is intended to promote fungibility—the ability for DNOs to switch spend among asset types within a cost category without losing TIM benefits—while excluding CAPEX–OPEX substitution from this flexibility. This may partly offset the reduced operational flexibility that follows from an expanded PCD regime. While more PCDs lock down a greater proportion of CAPEX to specific committed outputs, aggregate-level TIM limits preserve some room for DNOs to optimise how they deliver within those categories.
Delivery metrics and PCDs
A central challenge for the ED3 framework is how to hold DNOs to account for the delivery of funded network capacity in an environment where the location and timing of demand growth remain uncertain. The SSMD addresses this through a hybrid delivery accountability framework, rather than a single mechanism that is applied uniformly across all load-related expenditure.
The rationale for this hybrid approach rests on the structural differences across investment types within distribution networks (primary and secondary reinforcement).
The SSMD confirms that, for primary reinforcement, Ofgem expects delivery to be governed through the Output Delivery Mechanism (ODM)—a mechanism that pairs an output-based performance metric with an aggregate mechanistic PCD.
An open question—which has not been resolved in the SSMD—is about the choice of an output metric that will underpin the ODM.
Ofgem has also been explicit about the purposes of the new delivery framework. It is designed, in part, to address the risk under the ED2 TIM that a reduction in the volume of outputs delivered during a price control could be presented as efficient expenditure, from which companies would otherwise financially benefit through TIM-sharing.
It is clear that ED3 will represent a step change in investment relative to historical levels, although the magnitude of the associated increase in demand remains uncertain at this stage.
As a result, the SSMD indicates that the overall incentive package is likely to reduce DNOs’ flexibility in how they deliver funded activities relative to previous price controls, reflecting a greater emphasis on protecting customers from underdelivery. Less fungibility appears to be a given; the remaining question is at what level of granularity this will be applied.
At the same time, Ofgem appears to be minded to strengthen certain incentives, including the efficiency component of the BPI assessment and key ODIs such as connections, to ensure that appropriate rewards can be attained where this is in the consumer interest.
Financial parameters
Ofgem has set an indicative CPIH-real allowed return on capital of 4.35% for ED3 business planning purposes, based on a cut-off date of 31 March 2026. The allowance is based on a midpoint cost of equity allowance of 6.08% (CPIH-real) and a semi-nominal cost of debt allowance of 5.42%. These are to be revised in the DDs and FDs.
In relation to the return on equity allowance, Ofgem has largely maintained the RIIO-GD&T3 FD methodology as follows.
- The risk-free rate (RFR) is set based on the one-month average yield on 20-year index-linked gilts. The CPIH-real RFR of 2.09% is derived from an underlying RPI-real RFR of 2.05%, converted using an RPI–CPIH wedge of 0.04%, consistent with the RIIO-GD&T3 methodology.
- Equal weighting is assigned to ex ante and ex post total market return (TMR) evidence, resulting in a TMR range of 6.80–7.00% with a midpoint of 6.90%. Ofgem has not aligned itself with the PR24 CMA approach, which incorporated a ‘stable equity risk premium (ERP)’ methodology when setting the upper end of the range, although Ofgem applies ERP cross-checks to assess the reasonableness of its estimates.
- With respect to beta, Ofgem maintains its RIIO-GD&T3 methodology and places primary emphasis on ten-year daily beta estimates for European energy and GB energy and water networks. Ofgem estimates an asset beta range of 0.30–0.45 and, assuming a debt beta of 0.075 and notional gearing of 60%, derives an equity beta range of 0.64–1.01.
- In addition, Ofgem applies three market-based cross-checks to assess the reasonableness of its proposed capital asset pricing model (CAPM) cost of equity range, including transaction market-to-asset ratio (MAR) analysis, traded MAR analysis, and infrastructure fund-implied equity IRRs. Overall, Ofgem’s market-based cross-checks imply a cost of equity range of 5.03–6.89%, compared with its proposed CAPM-based range of 5.10–7.05%. Ofgem does not adopt additional cross-checks proposed during consultation, including debt-based approaches such as the asset risk premium–debt risk premium (ARP–DRP) framework or unlevered cost of equity vs cost of debt, as used by the CMA in PR24. However, Ofgem provides its calculations for those cross-checks.
In relation to the return on debt allowance, Ofgem has broadly maintained the RIIO-GD&T3 FD approach, while leaving several methodological parameters to be reassessed ahead of the DDs:
- setting only a proportion of the return on debt allowance in real terms, with the rest of it specified and applied in nominal terms without the corresponding RAV inflation indexation, i.e. using a semi-nominal return on debt;
- maintaining a working assumption of 10% index-linked debt exposure for business plans, while continuing to consider whether the final notional assumption should reflect actual company financing structures;
- setting the allowance based on the 14-year trailing average of the iBoxx GBP non-financials A/BBB 10+ indices while reassessing the final trailing average length and refinancing assumptions ahead of the DDs;
- not finalising additional borrowing cost allowances at the SSMD stage, while retaining RIIO-ET3 working assumptions of a 19bps additional borrowing cost allowance and a 39bps calibration adjustment for business plans;7
- on the infrequent issuer premium, while Ofgem has deferred its decision to the DDs, it sets out a framework for evaluation and indicates that the premium may not be needed.
In relation to investability, Ofgem has:
- stated that the CAPM-derived cost of equity sits comfortably within its cross-check range, which it views as evidence that returns are neither insufficient nor excessive;
- maintained the view that the overall ED3 risk–reward package, including incentive asymmetries, remains broadly comparable to RIIO-ET3 and does not undermine investability;
- rejected proposals to broaden its investability framework or introduce additional investability tests;
- not incorporated proposals to increase key parameters, such as the assumed dividend yield (kept at 3%) and the cost of issuing equity (kept at 5%).
Overall, Ofgem concludes that the package is investable, based on the ‘in the round’ assessment of investability rather than standalone investability tests.
Table 3 opposite compares the parameters of the weighted average cost of capital (WACC) set by Ofgem with those determined by the CMA in its PR24 FD.
Table 3 WACC allowance (CPIH-real or semi-nominal)
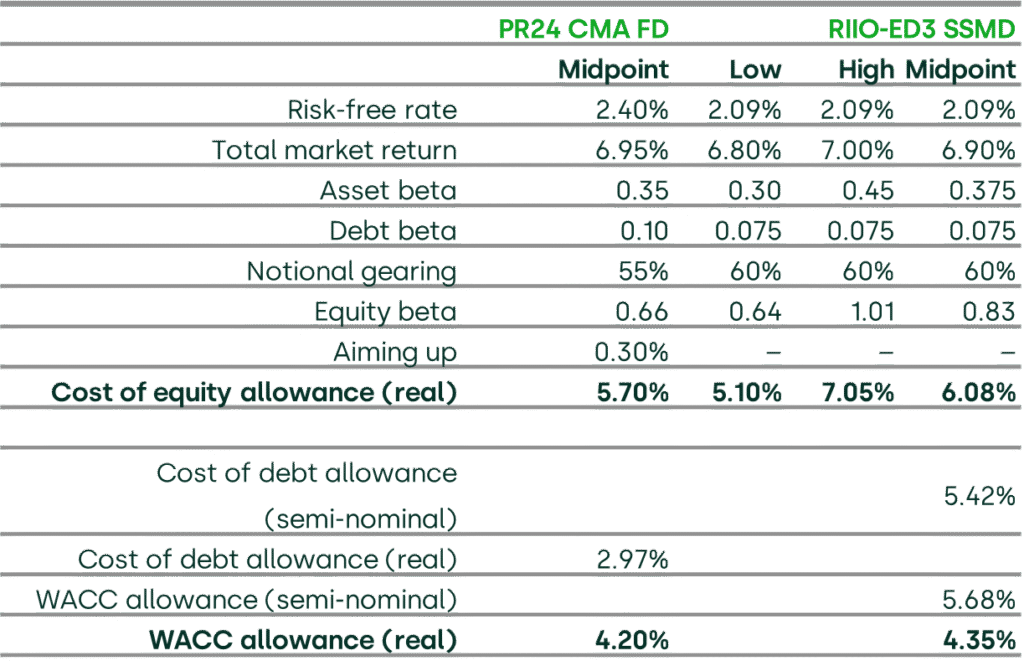
Source: Competition and Markets Authority (2026), ‘Water PR24 references: Final Determinations volume 4: allowed return – chapter 7’, 10 March; Ofgem (2026), ‘ED3 Sector Specific Methodology Decision – Finance Annex’, 21 May.
As for financeability, Ofgem retains the ‘in the round’ assessment approach set out in RIIO-GD&T3 and the ED SSMC, without introducing material departures from the existing framework. Ofgem continues to assess licensees on the basis of a notional capital structure against a BBB+/Baa1 target credit rating benchmark, consistent with RIIO-GD&T3. Ofgem also continues to incorporate long-term modelling in the financeability assessment through the extended form of the Price Control Financial Model (PCFM), as established in the RIIO-GD&T3 FDs. Relative to ED2, Ofgem introduces incremental refinements to the financeability assessment methodology, in line with the GD&T3 FDs, including refinements to the calculation of simulated credit ratios and the incorporation of additional credit metrics from S&P and Fitch. Ofgem confirms that potential adjustments to existing financeability levers such as setting capitalisation rates below natural rates will be considered further ahead of DDs.
Depreciation profile is also a key area of discussion in ED3. Ofgem recognises concerns that the move from a 20-year to a 45-year asset life assumption reduces depreciation revenues during the transition to the new methodology, resulting in a ‘depreciation holiday’. Ofgem notes the alternative approaches proposed by networks to smooth the transition, including shorter regulatory asset lives, accelerated depreciation profiles, run-off rate approaches, and depreciation ‘adders’. However, Ofgem does not propose changes to the existing straight-line depreciation methodology at SSMD stage and instead defers consideration of potential adjustments to the DDs.
Ofgem has largely maintained the RIIO-GD&T3 framework and, while responding to a broader range of stakeholder arguments and evidence, has not materially altered its methodological approach at this stage.
At the same time, several important areas—including depreciation profile, beta averaging window, cost of debt calibration, refinancing assumptions, additional borrowing costs, and financeability levers—remain open ahead of DDs, leaving significant elements of the finance package still to be determined. This makes continued stakeholder engagement and the submission of further evidence particularly important.
Next steps
DNOs are expected to submit draft business plan data templates (BPDTs) in July 2026, which will enable more detailed cost assessment modelling to begin in earnest. Final business plans are then due in December 2026 and will form the basis of Ofgem’s DDs expected in summer 2027.
In the meantime, stakeholders will follow developments in the CMA RIIO-GD3 appeals by gas distribution networks with interest, with a final decision due in September 2026, particularly on OE and certain aspects of cost assessment modelling, as the conclusions are likely to set a strong precedent for Ofgem’s approach in the DDs for ED3.
Footnotes
1 Ofgem (2026), ‘ED3 Sector Specific Methodology core document’, 21 May; and Ofgem (2026), ‘ED3 Sector Specific Methodology Decision – Cost assessment Annex’, 21 May.
2 Ofgem (2025), ‘ED3 framework decision’, 30 April, para. 1.14.
3 Ofgem (2025), ‘ED3 Sector Specific Methodology Consultation’, 8 October.
4 Implicit allowances is an approach used to identify the extent to which aggregate models (e.g. TOTEX) fund a specific cost category, and has been considered in the water sector. The mechanics involve removing a cost category from the model and re-running it to assess the impact. The difference between the modelled outcomes with and without the excluded category is then treated as the implicit allowance for that category.
5 See Competition and Markets Authority (2026), ‘Energy licence modification appeals 2026’.
6 The ratchet mechanism, which takes the lowest value of the DNO forecasts and Ofgem’s efficient benchmarks as baseline efficiency, provides adverse incentives for DNOs to hide their true efficiency in their business plans. While Ofgem confirms the use of the ratchet in ED3, it mitigates its distortive effect by adjusting the BPI to better reward DNOs’ business plan efficiency. This implies that forecast efficiency is still rewarded, instead of outperformance being lost through the ratchet mechanism.
7 The calibration adjustment is made to the trailing average of the preferred index, such that, in expectation, the allowance broadly matches the average actual efficient expected cost of debt of the networks in the chosen cohort.
Contact

Dr Srini Parthasarathy
PartnerContributors
Related
Related

Oxera responds to proposed changes to the UK’s competition and regulatory appeals frameworks
In July 2026, the Department for Business, Innovation, Science and Trade (BIST), then known as the Department for Business and Trade (DBT), launched a consultation on proposed reforms aimed at streamlining the UK’s competition redress, enforcement and regulatory appeals arrangements.1 Oxera provides economic advice to clients… Read More
 Podcasts
How should sustainability considerations be reflected in European Merger control?
Against the backdrop of the European Commission’s draft merger guidelines, our latest episode explores how sustainability can be given appropriate weight when assessing mergers. Helen Jenkins is joined by Simon Holmes, a Member of the UK Competition Appeal Tribunal and Visiting Professor in Law at the University of… Read More