
Ofgem RIIO-3 Draft Determinations
On 1 July 2025, Ofgem published its Draft Determinations (DDs) for the RIIO-3 price control for the GB electricity transmission (ET), gas distribution (GD) and gas transmission (GT) sectors for the period 2026 to 2031.1 The DDs set out the envisaged regulatory framework, including the baseline cost allowances, cost and output incentive as well as finance parameters. These have been calibrated by Ofgem with the intent to achieve the UK’s net zero and Clean Power 2030 (CP2030) plans, at the lowest possible cost, while ensuring safe and resilient networks. The recent introduction of Ofgem’s statutory duties on net zero (since June 2023) and economic growth (since May 2024) has shaped its stance on the calibration of the RIIO-3 price control package.
Ofgem approves £24bn of upfront total expenditure (TOTEX) for the five years of RIIO-3, which Ofgem positions as the start of a potential programme exceeding £95bn.2 We observe that alongside these investments into energy networks, the UK faces major investment demands in other sectors, increasing competition for capital among regulated sectors. For instance, in PR24, Ofwat has just approved £104bn in TOTEX for the 2025–30 regulatory period.3 Both sectors are expected to undertake significant amounts of capital investments: Ofwat stated that £12.7bn in fresh equity is needed in the next five years for water networks,4 compared with £22bn that Ofgem estimated for energy networks.5
Gas networks also compete for capital, while facing uncertainties in relation to the future of gas and as regards the extent of repurposing of networks that may be undertaken for hydrogen and carbon capture.
In light of these developments, Ofgem is trying to strike the right balance between keeping the networks attractive for investors, while maintaining affordability. On the latter, for example, Ofgem is separately consulting on giving consumers the option of zero standing charge tariffs.6
Ofgem further notes that enabling investments in ET will create savings for consumers. For example, it says that an additional increase of £52 in network charges by 2031, would lead to an £80 annual saving to consumers due to reduced gas use and lower system balancing costs, including lower constraint costs.7
Headlines
A few highlights of Ofgem’s DDs are outlined below.
- Across all three sectors, 26% of the baseline TOTEX requested by companies has been disallowed by Ofgem. This can be compared with the 33% disallowance in the RIIO-2 DDs.
- The allowed return on capital (CPIH-real) is 4.49% for National Grid Electricity Transmission (NGET), 4.61% for SP Transmission (SPT), 4.70% for Scottish Hydro Electric Transmission (SHET) and 4.22% for GD and GT.8
- The ongoing efficiency (OE) assumption is set at 1%.
- The Real Price Effect (RPE) mechanism indexes costs for labour and materials for all networks, and additionally indexes for plant and equipment costs for NGET and SHET.
- All companies have passed stage A of the Business Plan Incentive (BPI), meaning they met the minimum requirements, with five companies receiving rewards for their business plans and three receiving penalties, ranging from -12.4bps to 42.4bps of return on regulated equity (RoRE).
- The sharing factors in the TOTEX Incentive Mechanism (TIM) have declined in ET, now ranging from 0% to 25% of overspend or underspend borne by ET networks, compared with 33–49% in RIIO-2. TIM sharing factors in the GD sector are all set at 50% and is 39% for NGT—both broadly aligned with RIIO-2.9
- Ofgem remains committed to the central role of the Centralised Strategic Network Plan (CSNP) in enabling timely delivery of critical infrastructure, incentives for companies via a financial output delivery incentive (ODI-F), a re-opener, and a license obligation (LO).
- An additional reward-only incentive is to be introduced to encourage Electricity Transmission Owners (ETOs) to deliver investments more efficiently and innovatively across five specified areas, with rewards expected to be capped at 100bps of RoRE.
- A new connections capacity ODI-F is to be introduced for ETOs.
- An additional penalty-only ODI-F for time spent in outstanding gas escape repairs is being proposed for all gas distribution networks (GDNs).
- Based on Ofgem’s analysis, networks would have an opportunity to get rewards or penalties on common and bespoke ODI-Fs within the following ranges: -1.68% / +1.41% (+1.43% for SPTL) in ET,10 -0.51% / +0.34% in GD, and -0.75% / +0.65% in GT. While these ranges are presented as negatively skewed, Ofgem notes that they do not reflect probability-weighted outcomes.
- Ofgem further accelerates depreciation, however only for new assets added to the Regulated Asset Value (RAV) in GD, for these assets to be fully depreciated by 2050—the government’s net zero target date.
Cost assessment
The figure below compares network company submitted baseline TOTEX with Ofgem’s proposals following its assessment, which resulted in 26% of costs being disallowed by Ofgem across the three sectors.
However, Ofgem explains that the RIIO-3 framework remains adaptive, with additional funding likely to be unlocked through uncertainty mechanisms (UMs), primarily for ETOs but also for the GT and GD sectors.11 While Ofgem introduced frameworks like Accelerated Strategic Transmission Investment and Advanced Procurement Mechanism to enable earlier access to funding for ETOs, it noted a lack of project maturity that limited its ability to award baseline funding.
This lack of project maturity was reflected in Ofgem’s BPI assessment of ambition for ETOs, contributing to the decision to limit upfront cost allowances as a prudent risk management measure.
Figure 1 RIIO-3 Submitted compared to proposed TOTEX (£m, 2023/24 prices)
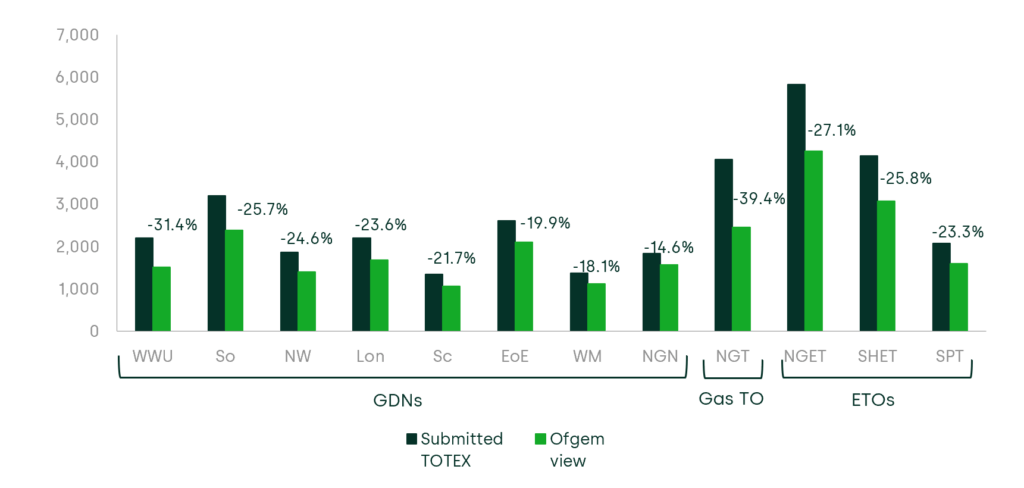
Source: Ofgem (2025), ‘RIIO-3 Draft Determinations Overview Document’, 1 July, Table 14.
Cost assessment for the GD sector
For the GD sector, Ofgem proposed to disallow 23% of company submitted costs (including ongoing efficiency challenge but before the application of real price effects). By network, this varies from 15% for Northern Gas Networks (NGN) up to 31% for Wales & West Utilities (WWU).
Ofgem’s approach to cost assessment for gas networks is almost identical to its approach for RIIO-2, consisting of the same three categories/types of cost assessments:
- a TOTEX regression covering 84% of submitted costs;12
- non-regression benchmarking covering 10% of costs;13
- technical (mostly engineering) assessment for the remaining 6% of costs.
The TOTEX regression model specification remains unchanged, benchmarking costs through a single top-down model, with a single composite scale variable (CSV) and two time trends to account for change in costs due to historical and future shifts in the efficiency frontier.
Ofgem proposed to retain the RIIO-2 ‘catch-up’ efficiency challenge, set at the 85th percentile after a three-year glide path from the 75th percentile.
Cost assessment for ET and GT sectors
In the ET and GT sectors, Ofgem proposes to disallow around 30% of proposed baseline expenditure across the four operators. NGT’s cost challenge is comparatively more significant, at 39%, versus 23–27% for ETOs. Additional expenditure may be approved through UMs over the course of T3, though the exact amount remains unspecified.
Unlike for GDNs (or electricity distribution networks at ED2), there is no top-down TOTEX modelling approach based on a set of econometric models. Instead, Ofgem disaggregates its cost assessment by activity using a toolkit of methodologies to assess the various cost categories that make up TOTEX. For ETOs, these methodologies include econometric modelling (e.g. indirect costs), unit cost benchmarking (e.g. load-related and non-load-related capital expenditure (CAPEX), engineering or expert reviews (e.g. for certain network operating costs), and qualitative assessments (e.g. for non-operational CAPEX). While these methodologies are also applied to assess NGT’s cost proposals, additional bespoke approaches—such as extrapolating historical cost trends—are used to reflect NGT’s unique position as the sole gas TO in Great Britain.
As cost categories are benchmarked separately for TOs, whether through econometrics or alternative modelling approaches, Ofgem has primarily opted for an average benchmark before aggregation to an overall TOTEX level.
OE and real price effects
Ofgem applies an OE challenge, intended to reflect the productivity improvements that even the most efficient company can achieve. The proposed OE target is 1.0% per annum for baseline TOTEX. Its application to certain UMs is still under consideration.
For RPEs, Ofgem is largely maintaining its RIIO-T2 approach, where TOTEX allowances are adjusted for inflation indices specific to cost categories, depending on the outturn changes in those indices, with some changes to indices used in RIIO-2. The cost categories adjusted for RPEs include labour and materials for all companies, and additionally plant and equipment for SHET and NGET.14
Ofgem has rejected proposed changes relating to labour retention costs, RPE index forecasting methods, and RPE adjustments in UMs. However, it is expanding the range of indices used, adding electrical and plant equipment indices for ET (except for SPT which is not covered by plant and equipment RPEs) and multiple material indices for GD. Ofgem has published forecast RPE adjustments rising gradually through 2030/31 across all sectors.
BPI
Ofgem refers to BPI as a truth-telling incentive, which was developed to encourage ambitious, high-quality business plans. Unlike RIIO-2, which involved four stages of incentives and penalties, and where BPI rewards and penalties were expressed as a percentage of TOTEX, the BPI in RIIO-3 is evaluated in three stages and rewards and penalties are specified in terms of the impact on the RoRE.
- Stage A assesses whether business plans meet minimum requirements (maximum penalty of 20bps). All companies passed the first stage with no penalties.
- Stage B evaluates cost efficiency and justification. Common costs are benchmarked comparatively, while bespoke costs are assessed qualitatively (maximum reward of 40bps across both, penalty up to 20bps). Five companies received a penalty ranging from 2.4bps to 8.0bps for their cost assessment while three received rewards ranging from 0.6bps to 37.6bps. NGN stands out as an outlier, receiving substantially higher rewards than other companies, with 37.6bps on RoRE.
- Stage C reviews the overall clarity of the business plan and the credibility and ambition of commitments (maximum reward or penalty of 20bps). Three companies received a penalty for their cost assessment ranging from 2.6bps to 4.4bps, and five received rewards ranging from 1.4bps to 8.9bps.
TIM
The TIM allows overspend or underspend, relative to baseline TOTEX allowances, to be shared between the company and consumers.
The TIM sharing factors have changed significantly for the ET sector since RIIO-2. The RIIO-ET2 TIM sharing factors were 33–49% (of overspend or underspend being borne by companies), while the proposed RIIO-3 TIM sharing factors are now in the range of 0–25%, depending on the scale of overspend and underspend (the ‘stepped’ approach).
- On the first 5% of any overspend or underspend, ETOs would bear 25% of an overspend and, symmetrically, retain 25% of any underspend.
- For overspend or underspend falling between 5 and 15%, the ETO will still bear 25% on the first 5% of overspend or underspend, but only 5% of any overspend and underspend for deviations beyond the first 5%.
- For any overspend and underspend beyond 15%, the step rules described above will still apply, with any overspend or underspend beyond 15% to be fully passed on to consumers.
Ofgem explained that the change is due to a significant investment pipeline, consisting of large capital-intensive projects, which are often subject to cost overruns.
In contrast to the ET sector, TIM rates in the GD sector are all set at 50% and the one for NGT is 39%—both broadly aligned with RIIO-2 without the stepped approach as applied to ET.15
Electricity transmission—incentivising timely delivery, innovation and connections
CSNP-F Delivery ODI-F
The CSNP-F Delivery ODI-F is a financial output delivery incentive (ODI-F) designed to encourage ETOs to deliver projects identified through the Centralised Strategic Network Plan (CSNP) on time or early, maximising consumer benefit.16 It applies to all designated CSNP-F Outputs and potentially some non-CSNP projects with significant consumer value. The ODI rewards timely delivery with a lump sum of 2.5% of forecast TOTEX plus additional daily rewards linked to estimated constraint cost savings for early completion, while penalties begin after a 12-month grace period following the Target Delivery Date (aligned with National Energy System Operator’s (NESO’s) Optimal Delivery Date), accruing at half the reward rate—with caps on maximum rewards (10% of TOTEX) and penalties (5% of TOTEX). A minimum availability standard (93% over 24 months) ensures assets remain operational post-delivery, and approved Delay Events can defer penalty start dates but do not affect eligibility for rewards.
A related reopener mechanism—CSNP-F Re-opener—will allow Ofgem to designate projects to being part of the CSNP during the price control period. Additionally, a new LO—CSNP Co-ordination LO—requires all TOs to regularly report on the quality and timeliness of their data submissions, improving the reliability of NESO’s strategic network plans.
Innovative Delivery Incentive ODI-F
Outside of the CSNP framework, Ofgem also intends to introduce a new financial, reward-only mechanism to encourage ETOs to adopt innovative and efficient approaches in delivering investment. The scope covers five key areas: supply chain savings, design and engineering innovations, speeding up project delivery, collaboration with the NESO on strategic planning and outages, and rollout of innovation funded through existing mechanisms (NIC/NIA/SIF).17 Ofgem has provided, for the purpose of consultation, an indicative reward range, capped at 50–100bps of RoRE. Rewards would be contingent on demonstrable consumer value exceeding a materiality threshold (£10m is proposed), and behaviours would be assessed by an Ofgem-led panel (to occur in 2028/29 and 2031/32) rather than against fixed metrics.18
Connections Capacity ODI-F
In the Sector Specific Methodology Decision (SSMD), Ofgem identified problems with the existing RIIO-ET2 ODI-Fs—the Timely Connections ODI-F and the Quality of Connections Survey (QoCS) ODI-F. In its DDs, Ofgem sets out two options for a replacement: one focused on the timely delivery of connections projects in a reformed connections landscape, and another focused on the increase of capacity specifically funded in RIIO-ET3. Ofgem favours the former. It would be asymmetric, with a cap on rewards of 0.4% of RoRE and a collar on penalties of –0.2% of RoRE.19 Ofgem notes that the ETOs had a desire to retain the QoCS financial incentive. While Ofgem is open to retaining QoCS as a reputational incentive, it would require ‘compelling assurances’ to allow the incentive to be an ODI-F once again.20
Other common transmission ODI-Fs include Energy Not Supplied (ENS), Interruption and Insulation Gas (IIG) emissions, and SO:TO Optimisation.
Gas distribution and transmission—accelerated depreciation
The gas sector faces an uncertain future, with pending policy decisions on the development of the Hydrogen Transport Business Model, the use of hydrogen for heating and the decision on hydrogen blending in the pre-existing network.21 Such decisions will affect the future usage of gas networks, and Ofgem has highlighted that this will impact its regulatory decisions for RIIO-3 and beyond.22
The main change introduced by Ofgem in RIIO-3 compared with RIIO-2 in relation to uncertainties around the future of gas relates to the depreciation policy of the RAV of GDNs in order to ensure a fair allocation of networks costs between current and future users.
Ofgem has decided to implement option four of the regulatory depreciation policy options identified in the SSMD:23 it further accelerates depreciation only for new assets, using a sum-of-digits depreciation profile with assets depreciated to zero by the government’s net zero target date (i.e. 2050).24 The depreciation policy of the RAV outstanding at the end of RIIO-2 remains unchanged (sum-of-digits method using a 45-year asset life assumption).25 Ofgem considers that the approach it adopts with regards to accelerated depreciation allows it to retain sufficient flexibility to react to changes in government policy, while sending the signal to investors that the regulator acts to manage asset stranding risk.26
As for GT, Ofgem decided not to make any further change to the current 45-year sum-of-digits RAV depreciation profile, citing the higher potential for asset repurposing and a relatively low RAV in this sector compared with GD as reasons not to make any change.27
In relation to the regulatory treatment of the repurposing and decommissioning of gas assets, Ofgem made no clear commitment given the significant uncertainty surrounding the future of gas. Separately from RIIO-3, to kick off discussing the treatment of repurposing of natural gas assets for both hydrogen and carbon capture and storage, Ofgem has set out a consultation on the asset valuation methodology for the transfer of natural gas assets between the regulatory asset bases.28 This consultation concluded on 1 July 2025 and as of the writing of this briefing note, there has been no decision in relation to that topic.
Finance
Ofgem is proposing a CPIH-real allowed return on capital of 4.49% for NGET, 4.61% for SPT, 4.70% for SHET and 4.22% for GD and GT. This is an increase across both ET, GD and GT relative to the SSMD, of around 40bps for GD&T and 55bps for ET. The increase is driven by: (i) the movement in the risk-free rate; (ii) an increased asset beta; (iii) a higher cost of debt allowance; (iv) a higher total market return (TMR).
Furthermore, as shown in Table 1, the weighted average cost of capital (WACC) proposed by Ofgem is higher than the WACC set by Ofwat in the PR24 Final Determinations. While this is partially explained by the movements in interest rates between the cut-off dates used, there are also notable differences in the parameter estimates.
Table 1 Return on capital allowance (mid-points, CPIH-real or semi-nominal)
Sources: Ofwat (2024), ‘PR24 final determinations Aligning risk and return – allowed return appendix’, December, Table 1, Table 8, and Table 13; Ofgem (2024), ‘RIIO-3 SSMD Allowed return on equity early view summary calculation’, August; Ofgem (2024), ‘RIIO-3 Sector Specific Methodology Decision – Finance Annex’, 18 July, Table 1 and Table 13; Ofgem (2025), ‘RIIO-3 Draft Determinations – Finance Annex’, 1 July, Table 17, Table 18 and Table 20.
In relation to the cost of equity allowance, Ofgem has largely confirmed the methodology set out in the SSMD.29
- The risk-free rate is set based on 20-year index-linked gilts and the RPI–CPIH wedge with no changes to the methodology outlined in the SSMD.
- Ofgem revisited the methodology for estimating the ex ante TMR in light of the evidence presented by the companies, resulting in an increase in the ex ante estimate and a smaller gap between ex ante and ex post estimates. Ofgem confirmed the intention to assign equal weight to ex ante and ex post estimates when setting the TMR.30
- In relation to beta, Ofgem confirmed the inclusion of the European energy comparators and Pennon in the sample.31 Furthermore, Ofgem is proposing to not include any gas-specific adjustments to the estimated beta.
For calibrating the cost of debt allowance to the actual companies’ costs, Ofgem has largely followed the approach set out in the SSMD, with the following highlights:
- setting only a proportion of the cost of debt allowance in real terms (30% for gas and 10% for ET), with the rest of it specified and applied in nominal terms without corresponding RAV indexation;
- calibrating ET and gas sectors separately;
- setting the allowance based on the average of the iBoxx GBP non-financials A/BBB 10+ indices, with uplifts of 45bps and 60bps and 19bps and 25bps allowances for additional costs of borrowing for the ET and gas sectors respectively.
- applying RAV weighting in the ET sector;
- no infrequent issuer premium.
In relation to investability, Ofgem has:32
- stated that the capital asset pricing model (CAPM) cross-checks it performed support the proposed allowed cost of equity range;
- rejected the additional investability tests proposed by the companies;
- addressed potential additional risks in RIIO-3 by (i) including the European energy comparators in the beta sample; (ii) accelerating depreciation for GD, instead of by increasing the allowed returns on equity;
- proposed the midpoint of the CAPM range as the point estimate of allowed cost of equity;
- retained the 5% equity issuance allowance set in RIIO-2.
As for financeability, based on its assessment, Ofgem considers all GT and GD licensees to be financeable on a notional company basis.33 For ET companies the financeability is achieved only by reducing the capitalisation rate from the natural rate of c. 100% to 85% for some TOTEX.34 Ofgem has used the Baa1/BBB+ as a target credit rating in the round.
Ofgem has also performed an analysis of RoRE, which shows that, based on ODI caps and collars, all networks have greater opportunities to be penalised than rewarded: the ET ODI-F range is -1.68% / +1.41% (+1.43% for SPTL), including the impact of CSNP-F,35 the GD range is -0.51% / +0.34%, and the GT range is -0.75% / +0.65%.36
Finally, Ofgem is proposing to retain the return adjustment mechanisms (RAM), proposing a 3% and 4% primary and secondary threshold around the baseline allowed return on equity for RIIO-3.37
Next steps
Network companies will now have until 26 August 2025 to provide Draft Determinations consultation responses, ahead of Ofgem’s Final Determinations later in the year. After Final Determinations, companies are able to decide on whether to appeal Ofgem’s decisions through the UK Competition and Markets Authority process.
Footnotes
1 Ofgem, ‘RIIO-3 Draft Determinations for the Electricity Transmission, Gas Distribution and Gas Transmission sectors’, available at: https://www.ofgem.gov.uk/consultation/riio-3-draft-determinations-electricity-transmission-gas-distribution-and-gas-transmission-sectors
2 Estimated as a potential £80bn ET programme and c. £15bn allowed baseline TOTEX for GT and GD.
3 Ofwat (2024), ‘PR24 final determinations Expenditure allowances’, 20 December, p. 1.
4 Ofwat (2024), ‘PR24 final determinations Aligning risk and return appendix’, 1 December, p. 71.
5 The £22bn of equity injections reflect the baseline case modelled by Ofgem as part of the financeability assessment. Specifically, the £22bn is composed of £8bn from NGET, £11bn from SHET and £3bn from SPT. See Ofgem (2025), ‘RIIO-3 Draft Determinations – Electricity Transmission Annex‘ , 1 July, Table 22.
6 Ofgem (2025), ‘Ofgem drives forward plans to introduce zero standing charge tariffs’, 20 February, https://www.ofgem.gov.uk/press-release/ofgem-drives-forward-plans-introduce-zero-standing-charge-tariffs (accessed 1 July 2025).
7 Ofgem (2025), ‘RIIO-3 Draft Determinations – Electricity Transmission Annex‘ , 1 July, p. 15.
8 The differences in the allowed return on capital across the different companies are due to the different gearing and return on debt allowances.
9 The only exception is NGN, which had a rate of 49% in RIIO-2.
10 Our understanding is that this includes the CSNP ODI-F, but does not include the potential to earn up to 50–100bps within the Innovative Delivery Incentive, which is still in design.
11 Among other UMs, Ofgem retains the Coordinated Adjustment Mechanism (CAM), despite its lack of use in RIIO-2. CAM allows for the transfer of activities and associated revenues from one network company’s price control to another.
12 Representing the predominant part of what Ofgem refers to as the ‘modelled costs’ assessment.
13 The smaller part of what Ofgem refers to as the ‘modelled costs’ assessment.
14 Only material cost categories are adjusted. Cost categories are considered material if they are forecast in company business plans to exceed 10% of TOTEX, or if they make up 5–10% of TOTEX and RPEs are expected to impact TOTEX by at least 0.5%.
15 The only exception is NGN, which had a rate of 49% in RIIO-2.
16 Ofgem (2025), ‘RIIO-3 Draft Determinations – Electricity Transmission‘ , 1 July, pp. 12–3.
17 NIC stands for Network Innovation Competition, NIA stands for Network Innovation Allowance, and SIF stands for Strategic Innovation Fund.
18 Ofgem (2025), ‘RIIO-3 Draft Determinations – Electricity Transmission’, 1 July, pp. 57–61.
19 Note that this is in contrast to the assumptions in Ofgem’s RIIO-ET3 DD business plan financial model (BPFM), which for connections assumes -0.3% / +0.3%.
20 Ofgem (2025), ‘RIIO-3 Draft Determinations – Electricity Transmission’, 1 July, pp. 20–25.
21 Ofgem (2025), ‘RIIO-3 Draft Determinations Overview Document‘, 1 July, para. 2.21.
22 Ofgem (2025), ‘RIIO-3 Draft Determinations Overview Document‘, 1 July, para. 2.22.
23 Ofgem (2024), ‘RIIO-3 Sector Specific Methodology Decision – Finance Annex’, 18 July, p. 181.
24 Ofgem (2025), ‘RIIO-3 Draft Determinations Overview Document‘, 1 July, para. 7.18.
25 Ofgem (2025), ‘RIIO-3 Draft Determinations – Finance Annex‘, 1 July, para. 8.9.
26 Ofgem (2025), ‘RIIO-3 Draft Determinations – Finance Annex‘, 1 July, paras 8.38 and 8.41–8.42.
27 Ofgem (2025), ‘RIIO-3 Draft Determinations Overview Document‘, 1 July, paras 7.10 and 7.20.
28 Ofgem (2025), ‘Natural Gas asset repurposing valuation methodology’, 20 May, https://www.ofgem.gov.uk/consultation/ofgems-proposed-asset-valuation-methodology-repurposing-natural-gas-assets-consultation.
29 Ofgem (2024), ‘RIIO-3 Sector Specific Methodology Decision – Finance Annex’, 18 July, pp. 45–126.
30 However, Ofgem’s lower bound is 6.8% (ex ante estimate), upper bound is 6.9% (ex post estimate), and the proposed TMR in use is 6.9%.
31 Compared with the sample of European energy comparators considered as part of the SSMD, Ofgem removed Italgas due to the unavailability of ten-year betas.
32 Ofgem (2025), ‘RIIO-3 Draft Determinations – Finance Annex’, 1 July, pp. 59–72.
33 Ofgem (2025), ‘RIIO-3 Draft Determinations – Finance Annex’, 1 July, p. 82.
34 Specifically, the reduction in the capitalisation rate applies to the bucket 2 TOTEX, which relates to re-openers and volume drivers. See Ofgem (2025), ‘RIIO-3 Draft Determinations – Finance Annex’, 1 July, p. 87.
35 But excluding the impact of the potential 100bps that ETOs could earn via the Innovative Delivery Incentive.
36 The ODI ranges include the impact of bespoke ODIs across all companies based on the information included in the respective RIIO-3 sector-specific DD BPFMs published by Ofgem. Also see Ofgem (2025), ‘RIIO-3 Draft Determinations – Finance Annex’, 1 July, p. 92.
37 Ofgem (2025), ‘RIIO-3 Draft Determinations – Finance Annex’, 1 July, pp. 92–94.
Contact

Elizaveta Kovaleva
PrincipalContributors
Related
Related

Behavioural economics: how does decision-making impact business and policy?
Behavioural economics is all around us — from competition rulings, like the Google Search ruling in the US, to EU regulations targeting online dark patterns. It affects how we combat consumer manipulation, design policy, and even understand the behaviour of music fans. In this latest episode, Helen Jenkins is joined… Read More

The reality gap: testing AI from compliance to enforcement
Companies and regulators often operate with distinct immediate objectives, e.g. profit maximisation versus consumer protection. Yet, as artificial intelligence (AI) increasingly permeates the economy, both sides face a shared challenge: navigating the opacity of complex algorithms. For companies, the primary imperative is risk management. A newly deployed algorithm that inadvertently… Read More