
What does the cost of debt tell us about the cost of equity?
Applications of the capital asset pricing model (CAPM) in some sectors (e.g. banking, utilities and infrastructure) imply very low estimates of the cost of equity. But when does ‘very low’ become ‘too low’? And what can be inferred from data observed in debt markets when it comes to estimating the cost of equity?
Equity versus debt
Companies are financed by debt and equity. Repayments to debt are fixed and known in advance (as long as the company does not default), while the remuneration to equity investors varies with the company’s performance (as equity is a residual claimant). It is therefore a basic principle of finance that against the same set of assets, equity financing is riskier and thereby more expensive to raise than debt.
Applications of the capital asset pricing model (CAPM) in some sectors (e.g. banking, utilities and infrastructure) imply very low estimates of the cost of equity. These estimates can at times be near to the cost of debt for companies in the sector. Figure 1 shows that this phenomenon is currently present in the utilities sector in the United Kingdom, with the most recent regulatory assessment of the cost of capital for electricity distribution (RIIO-ED2) being much closer to the yield on a benchmark cost of debt index than other assessments made over the previous two decades.
This raises the question as to whether these regulatory allowances adequately reflect the relative risks of debt and equity financing. This article considers tests that can be applied to sense check cost of equity assessments.
Figure 1 Nominal cost of equity and cost of new debt in UK regulatory decisions
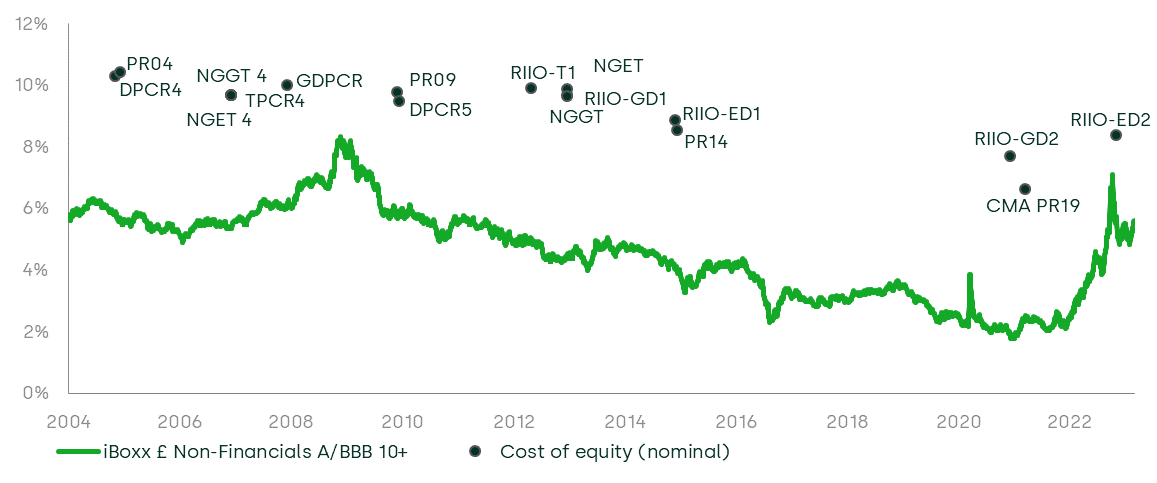
Note: Cost of new debt is the simple average of yields on the iBoxx £ Non-Financials A and BBB 10+ bond indices. Cost of equity is taken as regulators’ final point estimates; cost of equity determinations are not adjusted to a common gearing ratio. Cost of equity values have been converted to nominal terms by a Fisher equation; for CPIH-real determinations Bank of England long-run inflation target of 2% is used; the long-term RPI forecast is based on the long-term Bank of England CPI target, plus the long-term RPI–CPI wedge as stated by the Office for Budget Responsibility (OBR). The wedge used is 0.5% up to 2010, 0.7% up to 2015 and 1% thereafter. For the years before the Bank of England started targeting CPI, we use a 2.5% RPI target.
How low is too low?
Figure 1 shows estimates of the levered cost of equity1 that sit above the cost of debt. This is to be expected given that the debt ranks senior to equity in the hierarchy of claims on the assets, and is therefore lower risk. Indeed, this senior claim means that debt will expect a return lower than the weighted average cost of capital (WACC), and must be a strict lower bound for the WACC.
A slightly different comparison is to benchmark the unlevered cost of equity2 (i.e. the hypothetical cost of equity assuming an entirely debt-free capital structure). An estimate of the levered cost of equity for a company with debt can always be unlevered and compared against the cost of debt for that company. The unlevered cost of equity should be strictly greater than the cost of debt.
This test can be refined by estimating the risk premium for unlevered equity (i.e. the risk premium for investing in the assets) and the risk premium for debt. This approach is explained in detail in Oxera (2019)3 and Oxera (2020).4 Undertaking the analysis in terms of risk premia has the potential to generate more robust estimates of the cost of capital. This is because the difference between the asset risk premium (ARP) and the debt risk premium (DRP) may be subject to lower estimation error than estimates of the cost of equity.
Intuitively, while both the ARP and the DRP are subject to estimation error, to the extent that these errors act in the same direction, they will largely cancel out by taking the difference between the ARP and the DRP. For example, the estimates of both the cost of unlevered equity and the cost of debt are affected by uncertainty about the true risk-free rate. This leads to an unknown estimation error, but the directional impact of the error is the same on both the cost of unlevered equity and the cost of debt. The impact of this is eliminated by taking the difference between the ARP and the DRP.
An application of this approach to the recent cost of equity assessment for RIIO-ED2 is provided in Table 1. The analysis is based almost entirely on parameters published by Ofgem with a cut-off date of 31 October 2022.
The implied asset risk premium is 166bp compared with a debt risk premium of 146bp. The difference is 20bp, which is positive but provides a low margin of additional expected return for the additional risk of holding the assets, rather than a debt claim on the assets. In this example, the DRP has been reduced by 30bp because the expected return on debt will be lower than the yield on debt once the potential for default losses is accounted for (see the ‘expected loss’ row). Had this adjustment not been made, the ARP–DRP differential would be negative.
Table 1 Comparison of ARP to DRP for RIIO-ED2
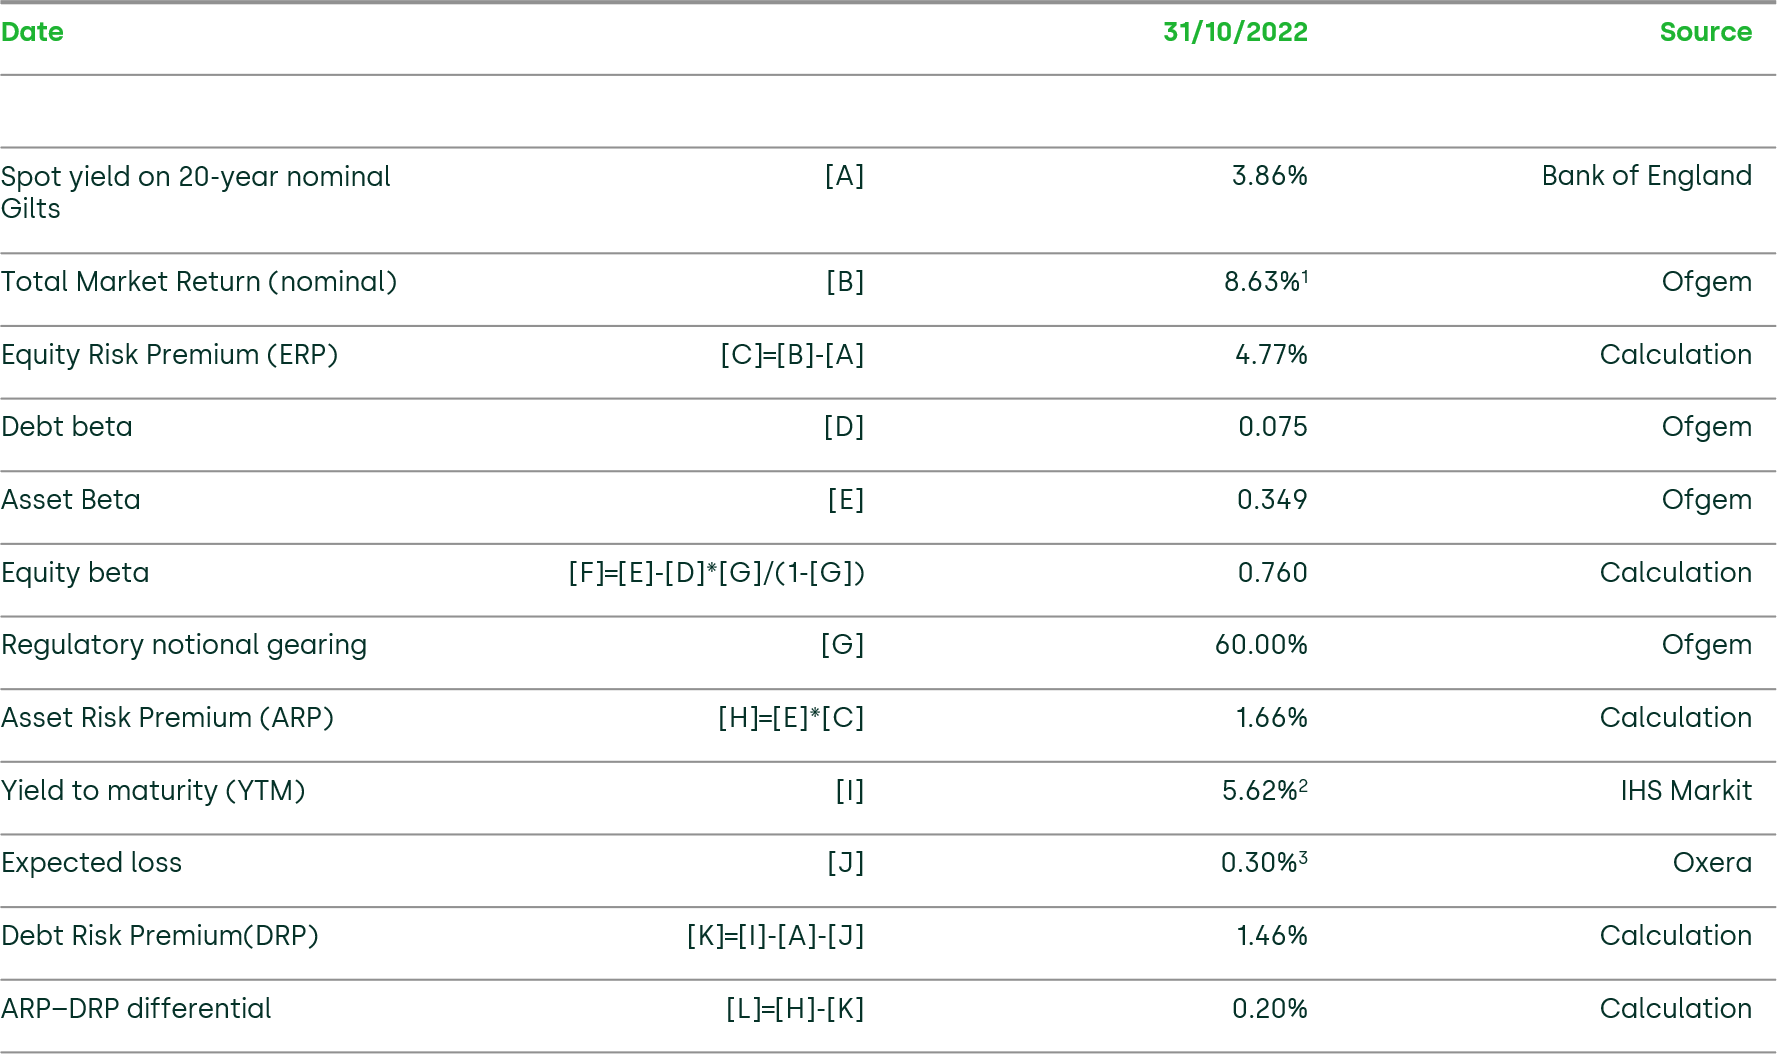
Sources: Ofgem (2022), ’RIIO-ED2 Final Determinations Finance Annex’, 30 November. Feldhütter, P. and Schaefer, S.M. (2018), ‘The myth of the credit spread puzzle’, The Review of Financial Studies, 31:8, pp. 2897–2942. Moody’s (2019), ‘Annual default study: Defaults will rise modestly in 2019 amid higher volatility’.
The example in Table 1 shows how using the CAPM can lead to very low or even negative estimates of the risk premium on assets relative to debt, and by implication the unlevered cost of equity relative to the cost of debt. While this comparison does not identify the cause or causes of the relatively low asset risk premium, it does prompt reconsideration of whether the input parameters5 have been correctly calibrated, or indeed if the CAPM is the correct model.
Concluding remarks
The above discussion shows how observable data from the debt markets can provide bounds on model-based estimates of the cost of equity, and thereby on the weighted average cost of capital.
This new approach to estimating cost of capital has implications that reach beyond the regulated utilities sector, and into other sectors with relatively low systematic risk, such as other infrastructure sectors, banking, and healthcare. It provides an additional perspective to be used alongside more traditional methods for estimating the cost of capital.
The conceptual basis of the ARP–DRP framework, as well as its empirical application, continues to be developed to increase its precision and practicality. In a future article, we will report on these developments, including how the framework can reduce bias in the estimation of the cost of capital.
1 The cost of equity at a specified proportion of debt finance to total assets.
2 The cost of equity after removing the effect of debt finance on the required equity return. It is calculated by un-levering the equity beta to obtain an asset beta.
3 Oxera (2019), ‘Risk premium on assets relative to debt’, 25 March.
4 Oxera (2020), ‘Asset risk premium relative to debt risk premium’, 4 September.
5 Risk-free rate, equity risk premium, equity beta.
Contact

Peter Hope, CFA
PartnerGuest author
Professor Julian Franks