
Social discount rates: inequality and the long term
The second article in this two-part series on Social Discount Rates (SDRs), as used in project and policy appraisal, discusses new evidence on how the rate at which the SDR declines could change, and how it could be adjusted to take inequality into account. Adjusting for inequality can reduce the discount rate even further than highlighted in our first article—to below 2%. The SDR could also decline more slowly than currently assumed. This would increase the benefit–cost ratio (BCR) of almost all projects seeking approval for government funding.
For an introduction to Social Discount Rates, see the first article in this series.
Social Discount Rates (SDRs) allow economists to place a present value on the future costs and benefits of projects that are intended to provide a societal benefit. Our first Agenda in focus article on this topic explained how the UK government calculates the SDR found in the Green Book,1 and why certain parameters of the SDR could change. The article showed that one reasonable approach could lead to a reduction in the SDR from the current rate of 3.5% to 2.45%.2
In this article, we move beyond a review of the existing parameters of the SDR to discuss the rate at which the SDR could decline over the long term, and whether it should be explicitly adjusted for social inequality. We then draw on the findings of the two articles to outline the implications for policymaking.
While we do not propose any particular SDR, we find that adjusting the SDR to account for social inequality could further reduce the SDR from 2.45% to 1.95%, and that the rate of decline could be materially different from that which is currently used. This would increase the net benefits associated with most projects and make it easier for them to pass cost−benefit analyses.
What is the rate at which the SDR should decline?
A declining SDR implies that the rate at which the net benefits of a project are discounted increases quicker in the short term than in the long term. Figure 1 in our first article showed that the Green Book uses a declining term structure.3 The specific shape of the term structure was presented in a 2002 report by Oxera and based on an academic paper by economists Newell and Pizer,4 who derived their estimates from the interest rates on US treasury bonds, and has not been changed since.
While the introduction of a declining SDR was a novel idea for government policy in the early part of the 21st century, it is now mainstream.5 The main reason economists give for a declining SDR is that the growth rate of consumption g, which is one of the parameters of the SDR, is both uncertain and ‘persistent’. The box below provides a reminder of the parameters of the SDR.
Parameters of the SDR
Since 2003, the UK Treasury’s Green Book has stipulated an SDR of 3.5% in real terms, based on a formula that represents the socially optimal discount rate, r:
r = δ+L + μg
Table 1 provides a reminder of what each of the parameters means.
Table 1 Elements of the SDR
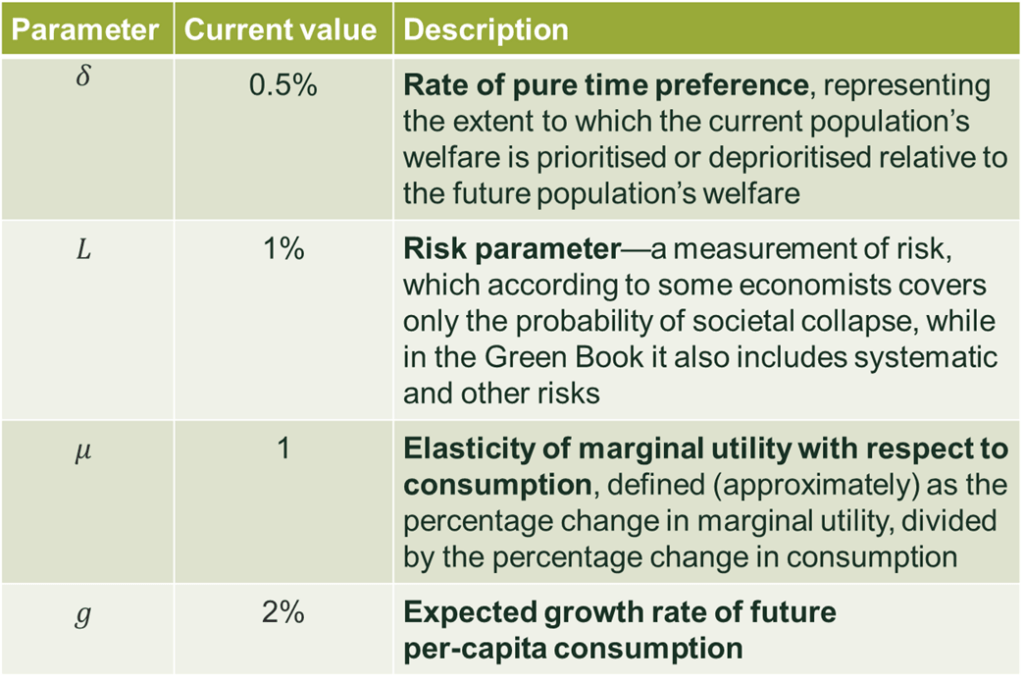
Uncertainty around g reflects random variation in the growth rate around some central estimate; for example, g might be 2% on average, but with some level of unknown deviation around it. Parameter g is persistent since the forces that cause g to change in a particular period are likely to cause it to change in the same direction in the next period.6
Persistent uncertainty in the growth rate generates a declining discount rate because shocks to g in a particular period are likely to be of the same sign as the shocks to g in a previous period. Such a process means that the range of possible future consumption growth rates is wider than under uncertainty alone.
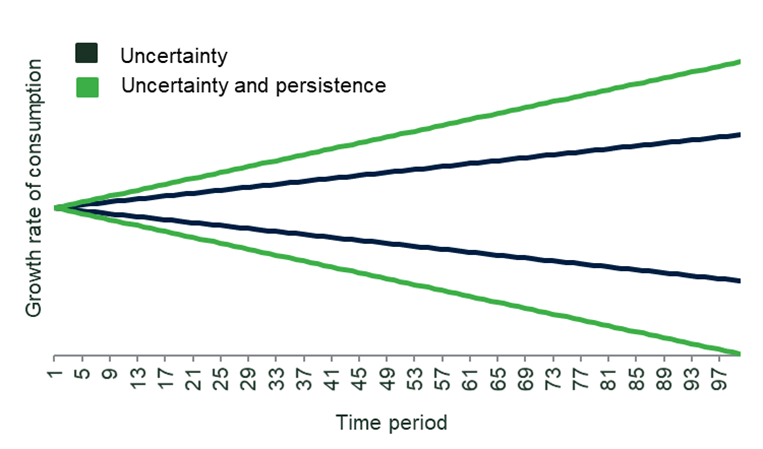
This is shown, in simplified form, in Figure 1. The dark green lines show a confidence interval for g under uncertainty, while the light green lines show one for g under both uncertainty and persistence. The range of possible outcomes is wider under the latter than under the former. If society is risk-averse, which is typically assumed to be the case, it will place greater weight on avoiding the bad outcome (very low growth) than on aiming for the good outcome (very high growth). Consequently, it will shift resources into the future as a precaution against the former. This precautionary motive is stronger further into the future, because there is a wider range of possible growth rates, which is why the SDR continues to decline in the future.
Figure 1 Range of growth rates of consumption under uncertainty, and under uncertainty plus persistence
While economists agree with the underlying theory that the SDR should decline, there is disagreement about the rate at which this should happen. There are two approaches to estimating the SDR.7 The first is a ‘structural’ approach that first derives a theoretical formulation of the SDR,8 and then estimates the values of all the parameters in that SDR. The second ‘direct’ approach first derives an equation that links the SDR to a parameter that reflects persistent uncertainty, and then estimates this parameter from a historical series of interest rates observed in the real economy. The logic behind the second approach is that if (a) market interest rates are driven by similar factors to the SDR and (b) historic movements in market interest rates reflect the likely movement of market interest rates in the future, then persistence in market interest rates will also provide a good estimate of the persistence, and therefore the term structure, of the SDR.9
The structural approach may be considered more theoretically justifiable10 because it allows for separate estimation of different parameters, each having its own economic interpretation. However, if any of the assumptions underlying the structural model are wrong, then it will be inaccurate. In this case, it may be preferable to adopt the direct approach.
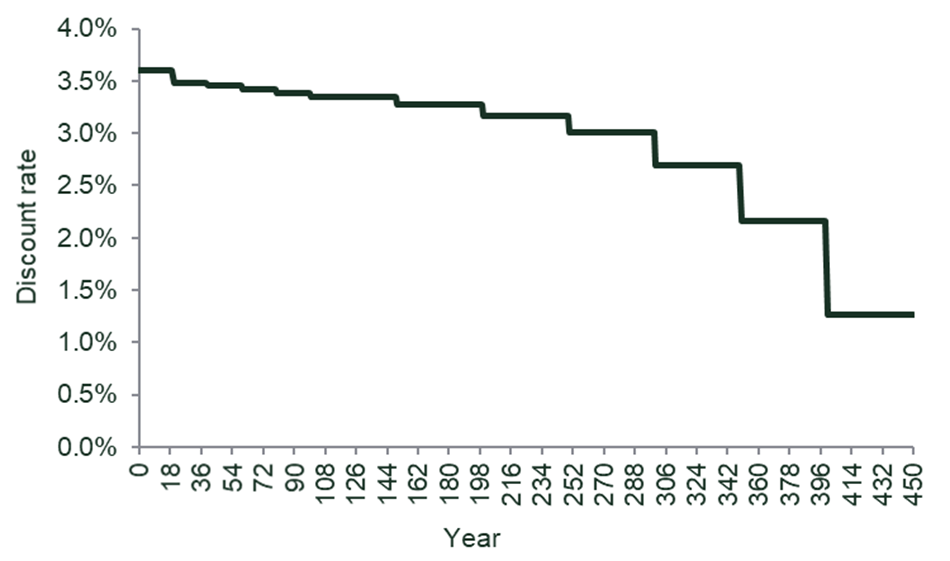
One example of the direct approach can be seen in a paper by Gollier et al. (2008), which estimates the term structure for several countries, including the UK. This term structure is shown in Figure 2.
Figure 2 Estimates of the term structure of the SDR for different countries
How could the SDR be adjusted to address inequality?
Intra-temporal inequality (i.e. inequality at a given point in time) does not naturally enter the standard SDR framework because distributional issues should be modelled explicitly by adjusting the costs and benefits in the cost–benefit analysis. Therefore, the SDR is not a tool that is used to assess the distributional impacts of individual policies.
However, intra-temporal inequality can be relevant in the SDR framework if different segments of society experience different growth rates of consumption. If future societies have more inequality than current societies, and are assumed to be averse to inequality, then SDRs will tend to be lower in order to create incentives to shift resources to the future to ‘compensate’ future societies for living with greater inequality. Conversely, if future societies are expected to have less inequality, then the SDR will tend to be higher because they will already be reaping the benefits of a more equal society. Clearly, if society does not care about inequality, then the SDR does not need to be adjusted to reflect it.
Incorporating concerns over trends in inequality can be done by adding a term to the SDR that reflects the difference in the growth rate of consumption for the median and mean person. This is because if g is increasing faster for the mean person than for the median person, inequality is increasing, so the SDR should be decreased (and vice versa). Adopting this sort of approach in the case of the UK could reduce the SDR by approximately 0.5%. Further details are provided in the box below.
Incorporating intra-temporal inequality
A simple approach to incorporating intra-temporal inequality was proposed in a paper by Emmerling et al. (2017), who suggested adding a term equal to μ2(gmed – gmean) to the SDR equation,11 resulting in an SDR of:12
r = δ+L + μgmean + μ2(gmed – gmean)
Here, the ‘g’ growth terms now carry subscripts indicating whether they refer to growth in median or mean income. If gmed is lower than gmean, then the rightmost term in the foregoing equation will become negative, reducing the SDR and implying that more resources should be shifted to the future. This reflects the intuition explained above, as if gmed is less than gmean, then in societies with positively skewed income distributions, it must be the case that wealthier segments of society are seeing faster consumption/income growth, so shifting resources to the future compensates for the fact that people are living in a more unequal society.
According to Emmerling et al., who look at UK data between 1979 and 2010, UK mean consumption growth has historically been approximately 0.22% higher than median consumption growth,13 which would result in a discount rate 0.22% lower if μ = 1 (as is currently the case), but 0.5% (0.495% ‘exactly’) lower if μ = 1.5, the value that the first article showed could be defensible.14
What are the implications for policymaking in the UK?
This section identifies the implications of the discussions in both of the Agenda in focus articles for the level and rate of decline of the SDR, as well as the implications for policymaking.
Implications for the SDR
While both of our articles on the SDR are far from a comprehensive assessment of whether and how the UK’s SDR should change, it is worth considering the implications of continuing with what we called the ‘alternative value’ in the first article.
The issues discussed in this article suggest that two further alterations could be made. First, the SDR could be reduced in order to reflect concerns over trends in inequality—as discussed, this would reduce the SDR by a further 0.5%,15 taking it from the 2.45% estimated at the end of the previous article to 1.95%. A full comparison of the current approach taken by the Green Book and the alternative approach is given in the table below.
Table 2 Alternative SDRs for the UK
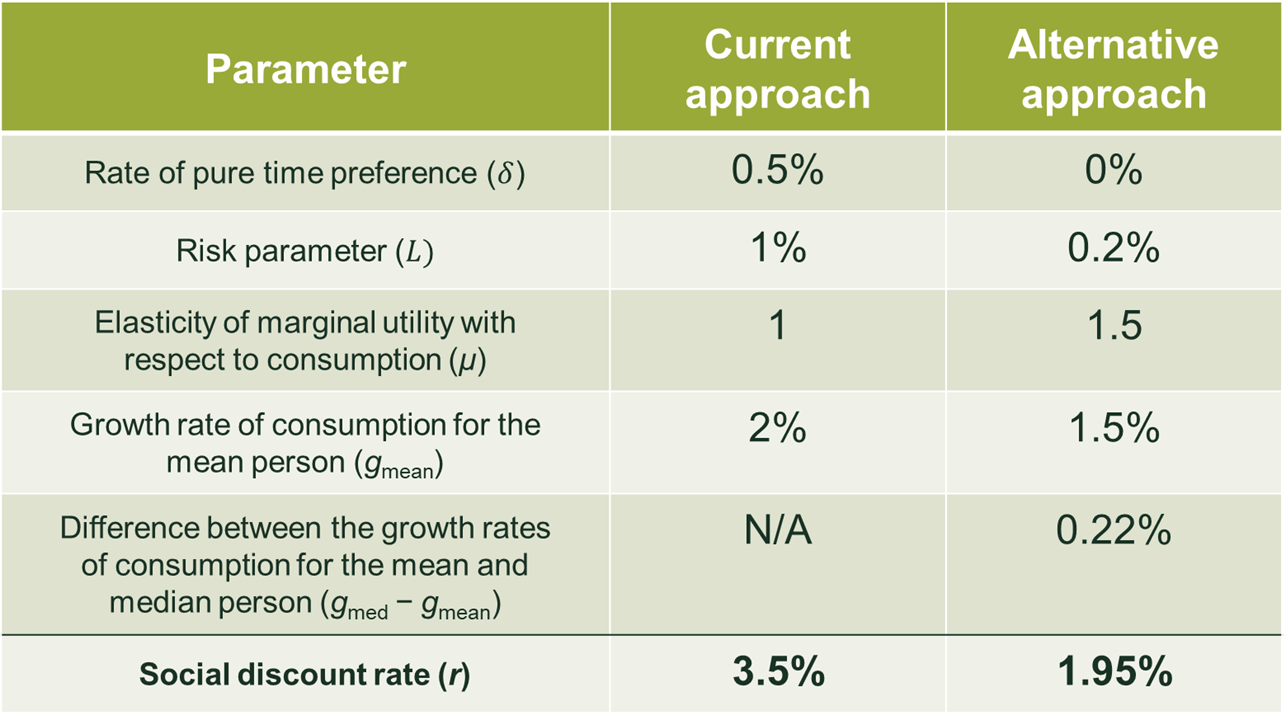
Source: Oxera.
Second, the rate at which the term structure declines would be adjusted to reflect the term structure for the UK as shown in Figure 2 (as opposed to one based on US data, as is currently the case). Figure 3 shows that the net effect of this adjustment would be that the SDR would start much lower, then decline initially at a far slower pace, but then accelerate in the long term (after 250 years or so).
Figure 3 Term structure of the SDR under alternative indexations
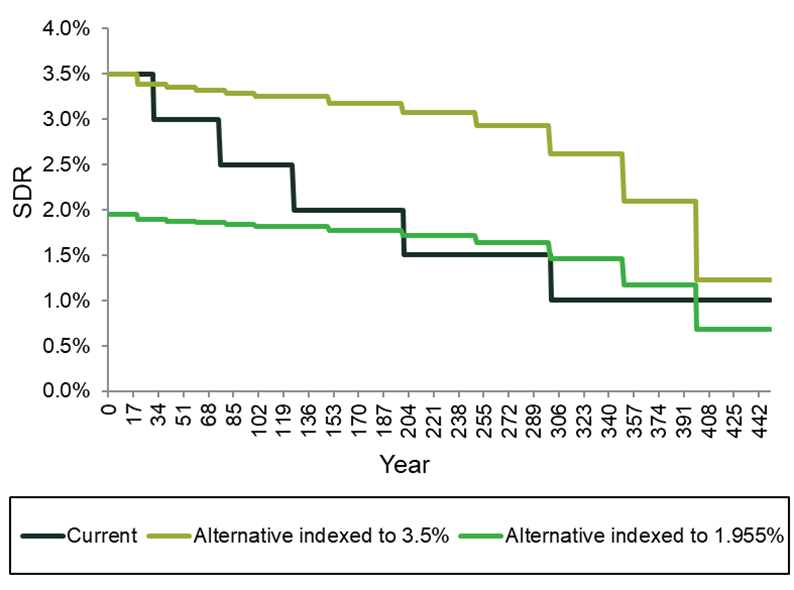
It turns out that the term structure in Figure 3 results in net benefits in every year being discounted less than under the current term structure.
Implications for policymaking
The fact that all net benefits would be discounted less under this alternative approach could be highly material for policymaking. Because of this, it is important to note that the SDR presented here should not be interpreted as a concrete proposal; instead, it provides one plausible alternative. To flesh out the implications of a change in the SDR, we now discuss what the policy implications of the alternative approach would be.
Most projects have a large cash outflow at the start, followed by several years of either monetary or non-monetary benefits. This means that projects can typically be seen as having a negative net benefit to begin with, followed by comparatively smaller positive streams of net benefits in the future.
Projects that follow this profile of net benefits would be more likely to pass cost−benefit analyses under the alternative approach than the current approach, because their benefits would be much less discounted, while the discounting of their costs would not materially change (so long as the upfront costs are not spread over too many years).
This could be beneficial for three major aspects of UK government policy: climate change measures; the ‘levelling up’ agenda (aimed at supporting less developed cities and regions in the UK);16 and the COVID-19-related ‘plan for jobs’, which includes an acceleration of planned infrastructure expenditure.17 In each of these cases, there is a large number of project types that would benefit from the higher discount factor, such as environmental protection schemes in climate change, and infrastructure projects within the levelling up agenda and the plan for jobs. This is because these types of project typically have the cost−benefit structure outlined in the paragraph above.
However, projects that have net costs for several years, such as subsidies for early-stage R&D, and which only start yielding benefits after several years, could be negatively impacted, as the costs that they incur in the early years would be discounted less than under the current approach.18 Of course, their future benefits would also be less discounted, so it is unclear precisely what the net effect would be. Examples of these types in the above-mentioned policy areas include government subsidies for R&D into early-stage climate-related technologies (such as electrolysers for clean hydrogen), or long-term infrastructure projects (such as HS2) that require many years of upfront investment and potentially a long delay before the benefits are realised. The precise effects on these project types would depend on whether the discount factor increased more for the period when the benefits come online, or the period when large cost outlays occur. Despite this possibility, it is likely that many projects would benefit from the alternative approach.
Where does this leave us?
These two articles on SDRs have shown that significant new research has been undertaken since 2003, the last time that the Green Book’s SDR was updated. This research raises questions over whether the existing parameters are estimated correctly and whether new parameters (such as those reflecting changes in intra-temporal inequality) should be added.
The implications of these debates are material, as we have shown that they could lead to an SDR of 1.95%, over 1.5% lower than the current rate of 3.5%, and which declines considerably slower than is currently the case. Under such an alternative (and we note that this is not the only alternative), more projects would likely pass cost−benefit analyses. Whatever the correct approach to the SDR is, we hope that these articles will stimulate debate on a topic that has perhaps been underappreciated in the UK, but which could have a major impact on cost−benefit analysis.
1 The Green Book is a manual written by Her Majesty’s Treasury that explains how applicants for government funding should present their business cases. Within it, there is a specification of the Social Discount Rate, which is used for cost–benefit analysis.
2 Oxera (2020), ‘A formula for success: reviewing the social discount rate’, September.
3 Ibid.
4 Oxera (2002), ‘A social time preference rate for use in long-term discounting’, December; Newell, R. G. and Pizer, W. A. (2001), ‘Discounting the Distant Future: How Much Do Uncertain Rates Increase Valuations?’, Resources For the Future Discussion Paper, May.
5 Freeman, M., Groom, B. and Spackman, M. (2018), ‘Social Discount Rates for Cost−Benefit Analysis: A Report for HM Treasury’, March, p. 14.
6 In statistical terms, one can say that the shocks to g follow an autoregressive process.
7 Gollier, C., Koundouri, P. and Pantelidis, T. (2008), ‘Declining discount rates: Economic justifications and implications for long-run policy’, Economic Policy, 23:56, pp. 758−95.
8 Note that this theoretical formulation will not be the same as equation (1) because that formulation did not include a term that was a function of time, meaning that equation (1) by definition cannot allow for a declining term structure.
9 See, for example, Newell, R. G. and Pizer, W. A. (2001), ‘Discounting the Distant Future: How Much Do Uncertain Rates Increase Valuations?’, Resources For the Future Discussion Paper, May, p. 4.
10 See, for example, Gollier, C., Koundouri, P. and Pantelidis, T. (2008), ‘Declining discount rates: Economic justifications and implications for long-run policy’, Economic Policy, 23:56, pp. 758−95.
11 See the equation in the first article or above.
12 See equation 10 in Emmerling, J., Groom, B. and Wettingfield, T. (2017), ‘Discounting and the representative median agent’, LSE Research Online.
Note that this equation has been slightly adjusted to separate out the risk parameter from the rate of pure time preference .
13 Emmerling, J., Groom, B. and Wettingfield, T. (2017), ‘Discounting and the representative median agent’, LSE Research Online, Table 1.
14 Oxera (2020), ‘A formula for success: reviewing the social discount rate’, September.
15 0.495%, to be precise.
16 See Gov.uk (2019), ‘The Queen’s speech and associated background briefing, on the occasion of the opening of parliament on Monday 14 October 2019’, pp. 74−93.
17 For details on the ‘plan for jobs’, see HM Treasury (2020), ‘A Plan for Jobs 2020’, 8 July.
18 This is not the case for projects that have all their costs arising in the first year, as (roughly speaking) the discount factor for these is equal to 1 under both the current and alternative approach.
Download

Related

When does a discount become deceptive? An economic framework for the regulation of reference pricing
The use of ‘reference’ pricing—where a previous (or future) ‘was’ price is displayed alongside the current ‘now’ price to indicate a discount for customers—is a common feature across digital and physical markets. In supermarkets, retailers commonly advertise a headline Recommended Retail Price (RRP), or ‘was’ price, alongside the current… Read More

No water, no growth: tackling inefficient business water demand
Water is not typically thought of as a constraint on economic growth in England. Yet that is precisely what it is becoming. Commercial growth and new developments are being turned away because there is insufficient water to serve them. Some water companies are already exercising their powers to refuse… Read More