
RIIO-3 Final Determinations
On 4 December 2025, Ofgem published its Final Determinations (FDs) for the upcoming RIIO-3 price control lasting from April 2026 to March 2031 for the electricity transmission (ET), gas transmission (GT), and gas distribution (GD) sectors.1 For electricity, Ofgem’s priority has been the delivery of the infrastructure, ‘to increase energy security and resilience and meeting government growth and decarbonisation targets’,2 while keeping a strong focus on cost control. For gas, the discussion has been around maintaining reliability and strengthening resilience, while managing the uncertain future of gas.
A few months ago, the UK Competition and Markets Authority (CMA) published its PR24 Provisional Determination (PD) for the water sector, which set some parameters and methodologies relevant for RIIO-3 FDs.3 In this article, we sometimes refer to the CMA PD.
The total expenditure (TOTEX) approved within the ex ante allowances for RIIO-3 is £43.3bn, with possibly more funding available via uncertainty mechanisms (UMs). Given the significant investment requirements, the speed of bill increases has been among Ofgem’s concerns and caused a change of approach introduced at the FDs stage—Ofgem has determined that the networks will not recover all revenues as defined by the regulatory building blocks in the corresponding years. Instead, the profile will be smoothened within RIIO-3 by reducing allowed revenues in the early years of the price control and offsetting allowed revenues on a net present value basis by increasing them in subsequent years.
Another implication of the significant investment requirements is that Ofgem has considered the need for ‘investability’ in RIIO-3—i.e. the need to ensure that the networks can attract investments. The concept was welcomed by networks, with ET focusing on the new equity that needs to be issued and GD and GT on the need to maintain investor confidence given uncertainties about the future of gas networks. In particular, ET networks have been pointing out that nominal returns on equity at around 9–10% would be competitive and that Ofgem’s package falls short of providing investors with this level with sufficient certainty—networks commented on TOTEX challenges, incentive reward opportunities and base return on equity allowance. Ofgem has responded that it does not target total nominal returns.
In the FDs, the allowed return on equity (CPIH-real, post-tax) is 5.70% for ET and 6.12% for GD and GT.
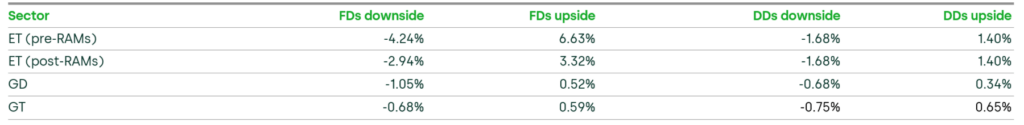
In addition, based on Ofgem’s analysis, networks would have an opportunity to get rewards or penalties on common and bespoke financial output delivery incentives (ODI-Fs) within the following ranges: for ET, the reward and penalties can range from -4.24% to 6.63% of the return on regulatory equity (RoRE) before accounting for the impact of the Return Adjustment Mechanisms (RAMs), from -1.05% to +0.52% of RoRE for GD, and from -0.68% to 0.59% of RoRE for GT.4 This compares with the following ranges in the Draft Determinations (DDs): from -1.68% to +1.40% (+1.43% for SPT5) in ET, from -0.68% to +0.34% in GD, and from -0.75% to +0.65% in GT—implying a notable widening of the range in ET and GD.
In ET, the range is underpinned by six financial incentives, to which various changes to the detail have been made since the DDs. The main increase in risk exposure relates to the Major Projects ODI-F.
Ofgem’s Business Plan Incentive (BPI) is designed to reward companies for high-quality, credible, and efficient business plans. While Ofgem has retained its DDs methodology, individual assessments for network companies have experienced notable adjustments, primarily in Stage B for costs assessed using comparative or bespoke approaches, though with the magnitude of change differing across companies. These adjustments reflect updates and revisions incorporated in Ofgem’s cost assessment approach. Overall, when combined with updated assessments of Stage C regarding the quality of the business plans,6 networks’ BPI outcomes range from -11.8bps to 11.8bps of RoRE, with six out of the eight companies receiving rewards.
As for TOTEX:
- Across the three sectors, Ofgem allowed for 85% of the baseline TOTEX requested by companies, compared with 74% at the DDs stage and 84% in the RIIO-2 FDs.
- The ongoing efficiency (OE) assumption remains at 1% per annum, in contrast to the CMA’s provisional decision of 0.7% per annum in the PR24 redeterminations.
- For real price effects (RPEs), Ofgem is retaining the overall approach outlined at the DDs stage, although with significant additions such as varying cost category weights over the price control period and applying the RPE mechanism to some UM expenditure.
- The TOTEX incentive mechanism (TIM) sharing factors for GT and GD remain at 39% and 50% respectively, however, for ET, Ofgem has changed the sharing factor bands such that ETOs must bear a larger share of over- and underspend than proposed in the DDs (increasing the risk exposure).
Ofgem has also retained the Return Adjustment Mechanisms (RAMs), symmetrically limiting the outperformance and underperformance potential. After consulting with stakeholders on the matter, Ofgem decided that Accelerated Strategic Transmission Investment (ASTI) projects will be included within the wider RAMs, rather than as separate RAMs, considering that setting separate RAMs for ASTI would not allow investors to assess company investability in the round.7
Finally, on the cash flow profiles, in ET, Ofgem has maintained the acceleration of the recovery of cash flows via lower than natural capitalisation rates at 85% for some of the expenditure. For GD, as in the DDs, Ofgem accelerates depreciation for new assets added to the Regulated Asset Value (RAV), for them to be fully depreciated by 2050—the government’s net zero target date.
Ofgem’s proposed revenue reprofiling—reducing revenues in 2026/27 and 2027/28 and increasing them in later years to smooth the anticipated bill impact—is assessed to have only a moderate effect on financeability ratios when averaged across the five-year period, and is therefore viewed as consistent with maintaining a Baa1/BBB+ rating.
In the rest of the article, we go through these in more detail.
Allowed return on capital
Ofgem has determined a CPIH-real allowed return on capital of 4.42% for NGET,8 4.56% for SPT, 4.66% for SHET9 and 4.34% for GD and GT. This is an increase relative to the DDs, mainly driven by the movements in market data, defining the risk-free rate (RFR) and cost of debt between the cut-off dates.
In relation to the return on equity allowance, Ofgem has largely confirmed the methodology set out in the DDs.10
- The RFR is set based on 20-year index-linked gilts and the RPI–CPIH wedge with no changes to the methodology outlined in the DDs. The CPIH long-term forecast is now set at 2.1%, in line with the 5th year of the prevailing OBR CPIH forecast.
- Equal weighting is assigned to both ex ante and ex post total market return (TMR) estimates, in line with the proposed approach in the DDs.11 Ofgem has not aligned itself with the PR24 PD, in which the CMA set the top end of the range using a ‘stable equity risk premium (ERP)’ approach, adding the average historical ERP to the RFR estimate to estimate the TMR.
- With respect to beta, Ofgem maintains its approach in the DDs, and sets the same beta for all sectors.
For setting the return on debt allowance, Ofgem has largely followed the approach set out in the DDs, with the exception of the CPIH forecast. Ofgem has set a CPIH forecast at 2.08% (by OBR) rather than 2.0% (long-term Bank of England target) used in the DDs, marginally lowering the return on debt allowance in CPIH-real terms.
The key highlights on the return on debt allowance are set out below:
- setting only a proportion of the return on debt allowance in real terms (30% for gas and 10% for ET), with the rest of it specified and applied in nominal terms without the corresponding RAV inflation indexation;
- calibrating ET and gas sectors separately;
- setting the allowance based on the 14-year trailing average of the iBoxx GBP non-financials A/BBB 10+ indices, with uplifts of 39bps and 72bps for ET and gas respectively (compared to 45bps and 60bps in the DDs), based on the calibration;
- 26bps and 32bps allowances for additional costs of borrowing for the ET and gas sectors respectively (up from 19bps and 25bps);
- applying RAV weighting in the ET sector;
- no infrequent issuer premium;
- CPIH long-term forecast of 2.08%.
In relation to investability, Ofgem has:12
- stated that the capital asset pricing model (CAPM) cross-checks it performed support the proposed cost of equity range;
- discontinued the use of the OFTO bid-implied returns as a cross-check and rejected additional investability tests proposed by the companies;
- provided more transparency on the estimation of the cross-checks and made some methodological changes as compared to the DDs;
- confirmed the midpoint of the CAPM range as the point estimate of allowed return on equity;
- retained the 5% equity issuance allowance and 3% dividend yield assumption proposed in the DDs.
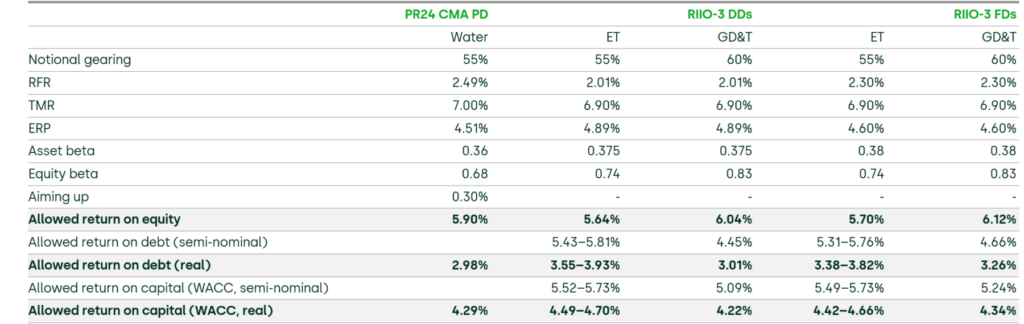
Table 1 Return on capital allowance (point estimates, CPIH-real or semi-nominal)
Source: CMA (2025), ‘Provisional Determinations Volume 4: Allowed Return, Risk & Return, Provisional Determinations, Next steps – Chapters 7–10’, 9 October, Table 7.1; Ofgem (2025), ‘RIIO-3 Draft Determinations – Finance Annex’, 1 July, Table 17 and Table 18; Ofgem (2025), ‘RIIO-3 Final Determinations – Finance Annex’, 4 December, p. 44.
Table 1 compares the parameters of the weighted average cost of capital (WACC) set by Ofgem with those determined by the CMA in its PR24 PD and Ofgem’s parameters from the DDs. As shown, the return on equity allowance set by Ofgem is lower than that set by the CMA in the PR24 PD. This is partially explained by market movements between cut-off dates, although there are notable differences in the parameter estimates including the asset beta and the aiming up on the cost of equity.
As for financeability, Ofgem retains the position set out in the DDs, without introducing further changes.13 Ofgem’s assessment indicates that all GT and GD licensees are financeable on a notional company basis. For ET companies, financeability is achieved only if the capitalisation rate for specific elements of TOTEX is reduced from the natural level of around 100% to 85%. Ofgem continues to benchmark its assessment against a Baa1/BBB+ target credit rating.
Incentives: BPI and ODIs
For both the gas and electricity sectors, Ofgem applies a truth-telling incentive, the BPI. The BPI is intended to reward companies for submitting ambitious and high-quality business plans. In line with the DDs, the BPI for FDs continues to be assessed across three stages, with rewards and penalties expressed in basis-point (RoRE) impacts rather than as a percentage of TOTEX as in RIIO-2. Ofgem has proposed no methodological changes to the BPI framework, although some outcomes–particularly at Stage B–have been revised to reflect the various changes made by Ofgem in its cost assessment modelling approaches, as outlined below within the cost assessment sections.
- Ofgem confirmed that all business plans meet the minimum quality standard. There is no change between the DDs and FDs for Stage A outcomes.
- Stage B, which assesses cost efficiency and justification, comprises two elements: comparative costs, where common costs are benchmarked, and bespoke costs, assessed qualitatively. For comparative costs, companies saw an average reduction of 2.9bps, largely driven by the updated outcome for one GD network (GDN). For bespoke costs, the average difference between FDs and DDs was a modest increase of +0.8 bps.
- Stage C evaluates the overall quality and credibility of business plans, focusing on clarity and the ambition of companies’ commitments. On average, companies received +1.2bps more for clarity and +1.3bps more for commitments in the FDs compared with the DDs.
Overall, networks’ BPI outcomes range from -11.8bps to 11.8bps of RoRE.
As for ODIs, in ET, Ofgem is setting six financial incentives: Energy Not Supplied (ENS), Insulation and Interruption Gas (IIG) emissions, SO:TO, Innovative Delivery, Connections and Major Projects.
Three incentives are of particular note.
- Major Projects ODI-F (CSNP-F Delivery ODI-F in the DDs). This multi-faceted ODI aims to incentivise the timely delivery of significant new ET projects. Various changes have been made since the DDs, including expanding the risk range—upside of up to 20% of project TOTEX, downside of up to 10% of project TOTEX (versus 10% upside, 5% downside in the DDs). Ofgem regards this asymmetry as providing a ‘fair bet’ for ETOs over RIIO-ET3. Nonetheless, Ofgem also acknowledges that, potentially, more investments incentivised under the ODI-F will be delivered in RIIO-ET4 than in RIIO-ET3. The annual reward/penalty range for this incentive is -1.87% / +3.75% of RoRE.14
- Innovative Delivery Incentive ODI-F. This is a new financial, reward-only mechanism to encourage ETOs to adopt innovative and efficient approaches in delivering investment, introduced in the DDs. It will be assessed across five areas (more clarity on weights across these areas has now been provided, relative to the DDs). In the DDs, Ofgem suggested that assessments would be made by an Ofgem-led panel of experts (in 2028/29 and in 2031/32). In the FDs, Ofgem has decided that it would determine the outcome itself, albeit supported by non-binding recommendations from a panel. The assessments have also been brought forward (to 2027/28 and 2029/30). ETOs raised concerns around the subjectivity and/or lack of detail in the proposals. Additional detail has now been provided, but Ofgem has continued to push back on measuring success against fully quantitative ex ante assessment criteria. The maximum annual reward for this incentive is 0.20% of RoRE,15 compared to the 0.10%–0.20% proposed in the DDs.16
- Connections Capacity ODI-F. In its DDs, Ofgem set out two options for a replacement of the existing connections incentives: one focused on the timely delivery of connections projects (the option preferred by Ofgem), and another focused on the increased network capacity. The first option has been confirmed in the FDs. If major developments in government or regulatory policy necessitate additional changes to the connection dates of a significant number of projects, Ofgem would review the appropriateness of the affected target dates. The annual reward/penalty range for this incentive is -0.20% / +0.40% of RoRE.17
Table 2 compares the overall ODI risk exposure in the FDs as compared to the DDs. This shows how the RoRE range has widened for ET since the DDs—which is driven mainly by the expanded risk range for the Major Projects incentive.18
For GD networks, incentive structures remain largely consistent with the DDs, with some targets updated based on the latest Regulatory Reporting Pack (RRP) data. However, for the six ODI-Fs that were outlined in the DDs (customer satisfaction, complaints, unplanned interruptions, collaborative street works and 7 & 28 day repair standards), Ofgem has recalibrated the incentives such that the overall RoRE incentive exposure is higher in the FDs. The rationale is to maintain the equivalence for each ODI with 0.5% of the base revenue exposure (set out as an objective in the Sector Specific Methodology Decision). For each ODI-F, this increases the risk exposure, from 0.17% to around 0.26% of RoRE. As shown in Table 2 this then widens the overall upside/downside RoRE range (when summed across the ODIs).
Since the DDs, Ofgem has also introduced new reporting requirements for the Emergency Response Time and Priority Service Register Customer Satisfaction reputational ODIs (ODI-Rs), to enable publication of comparative performance rankings, which in Ofgem’s view strengthens reputational incentives.
TOTEX
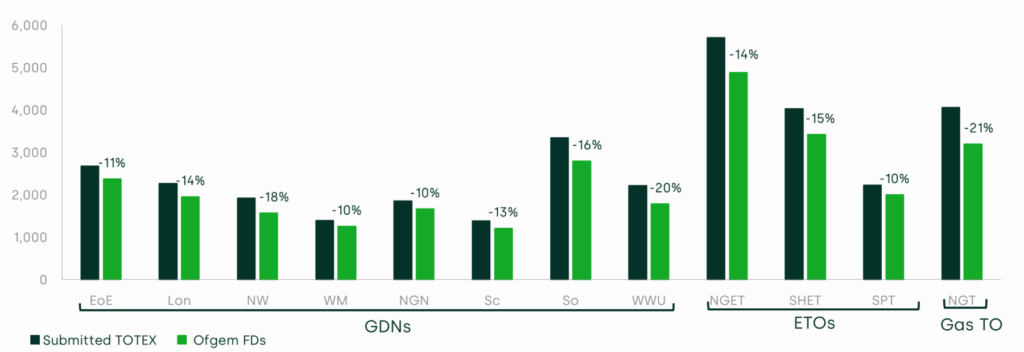
Figure 1 below compares networks’ submitted baseline TOTEX with Ofgem’s FDs. Relative to the DDs position, Ofgem has allowed an additional £3.9bn, of which £350m reflects companies’ additional requests since the DDs representations, while the majority of the increase is due to changes in Ofgem’s approach. This reduces the industry gap between requested and allowed TOTEX from 26% in the DDs to 15% in the FDs.
Table 2 ODI risk ranges (% of RoRE)
Source: Ofgem (2025), ‘RIIO-3 Final Determinations financial models’, 4 December, Ofgem (2025), ‘RIIO-3 Draft Determinations financial models’, 1 July’
Figure 1 RIIO-3 TOTEX allowances, submitted vs provided in the FDs (£m, 2023/24 prices)
Source: Ofgem (2025), ‘RIIO-3 Final Determinations: overview document’, 4 December, Table 19.
Cost assessment for ET and GT
Following the consideration of DDs responses, Ofgem has reduced the cost challenge applied to the four operators’ proposed baseline expenditure from 30% to around 16%. As in the DDs, NGT’s19 21% cost challenge remains higher than those applied to ETOs, which lie between 10% and 15%.20 Consequently, baseline TOTEX allowances increase by £1.5bn (16%) for ETOs and £0.7bn (30%) for NGT.21
Notable methodological modelling changes made by Ofgem relate to the assessment of indirect costs, which resulted in an additional £0.8bn for TOs, representing a 24% increase. While numerous detailed amendments have been made to the assessment of indirect costs, the most significant ones are outlined below.22
- Specific sector-level assessment. Ofgem moved away from both its T2 approach and the combined ET-GT assessment proposed at the DDs stage for business support costs, which are now assessed separately for ETOs and NGT. Closely Associated Indirect (CAI) costs were already assessed in this way and continued to be so.
- Greater emphasis on company-specific circumstances. A 50:50 weighting was previously applied between econometric modelling of historical costs and forward-looking TO-specific ratio and trend analyses. Ofgem has now increased the weighting to 70% for the latter for the ET sector, while NGT is assessed independently to reflect its sector-specific characteristics. This alternative weighting is in light of stakeholders’ feedback, and Ofgem further justifies it by noting that it is consistent with the recommendations of the Independent Water Commission in its recent review of the water sector: ‘This approach is consistent with the Cunliffe review recommendation to give greater consideration to company-specific conditions and challenges’.23
- Increased recognition of the impact of Full Time Equivalent (FTE) employees on business support costs (ET sector only). In response to stakeholder feedback, Ofgem increased the weighting assigned to FTEs in the business support cost modelling from 11.5% to 55.7%, reducing the weighting for Modern-Asset-Equivalent-Value (MEAV) from 79.5% to 35.3%. Ofgem acknowledged that ‘this adjustment better reflects the relationship between BSC [Business Support costs] […] and its underlying cost drivers’.24
- Removal of a time trend in the CAI modelling (ET sector only). In its DDs, Ofgem included a time trend in the CAI modelling, which was estimated to be negative, implying that costs are falling over time and would continue to fall in T3. Ofgem corrected this in response to TOs’ concerns that the time trend was statistically insignificant and lacked supporting economic or engineering rationale.
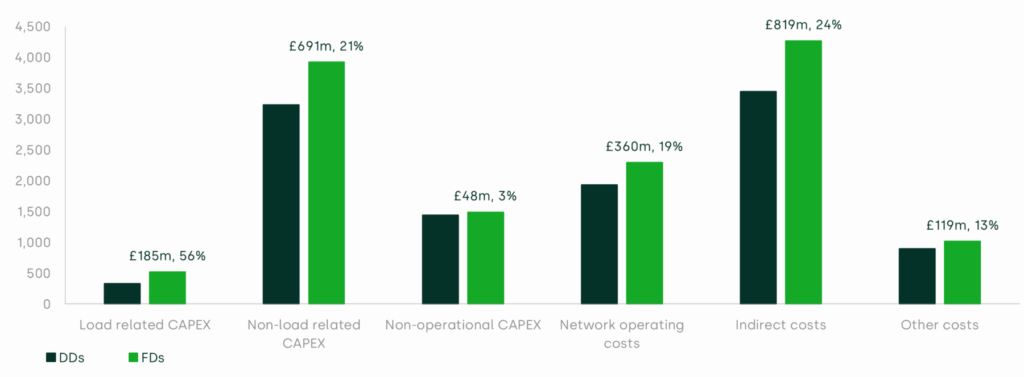
In absolute terms, most of the remaining movements in baseline allowances are driven by a £0.7bn increase in non-load-related capital expenditure (CAPEX) and a £0.4bn increase in network operating costs. Figure 2 provides a comparison of the combined TOs’ baseline cost allowances.
Figure 2 Increase in TOs’ baseline funding by cost category between Ofgem’s DDs and FDs (£m, 2023/24 prices)
Cost assessment for GD
In GD, Ofgem has largely retained the broad cost-assessment framework proposed in the DDs, including a single TOTEX regression model, the same modelling period, cost drivers and the catch-up efficiency challenge via a three-year glide path from the 75th to the 85th percentile.
However, the FDs introduce significant changes to pre-modelling normalisations and to the scope of costs assessed outside the econometric modelling, resulting in material movements in allowances. As a result, the total industry baseline TOTEX proposed by Ofgem has increased by £1.8bn, or 11%, compared to Ofgem’s DDs position.
Regional and company-specific adjustments have been revised significantly in places. While the regional labour factor remains unchanged, Ofgem has increased the scale and scope of both the sparsity and urbanity adjustments, reflecting the evidence put forward in the consultation responses. Sparsity now applies to replacement expenditure (REPEX), alongside increased emergency and repair adjustments. Urbanity-related productivity and reinstatement adjustments have been replaced with a single Nature of Streets factor, similar to the approach adopted in ED2. The latter is complemented by company-specific factors for property and population density for the London and Southern networks.
Figure 3 illustrates the scale of pre-model normalisation for regional factors across GDNs (relative to the baseline TOTEX assessed under the TOTEX regression at DDs and FDs, respectively25). This shows that the scale of the pre-model adjustment has increased for GDNs in sparse and dense areas, in particular.
Figure 3 Size of regional factor adjustment per GDN

Source: Oxera analysis based on Tables 19 and 17 in Ofgem (2025), ‘RIIO-3 Final Determinations – Gas Distribution’, 4 December.
Within the composite scale variable used in the TOTEX modelling, the main pre-model normalisation was to REPEX tier 1 mains.26 The underlying issue was that companies had submitted tier 1 mains forecasts inconsistently, using different assumptions for lay-to-abandon ratios.27 To address this, Ofgem has replaced company-submitted lay (commissioning) forecast volumes with a consistently normalised lay-to-abandon profile.28 Both tier 1 REPEX workloads and costs have been adjusted accordingly, resulting in a material change to the construction of the cost driver, and thus, networks’ relative positions.
Despite representations from GDNs regarding the cost associated with increased REPEX complexity, Ofgem has not introduced an explicit adjustment for REPEX complexity. Ofgem’s rationale is that the costs of increasingly complex workloads are already captured within the model through rising unit costs within the REPEX synthetic cost driver and the inclusion of a time trend variable.
There are also considerable changes to the scale and scope of costs assessed outside the TOTEX regression. Ofgem has allowed additional costs through separate assessments, particularly, for Multi-Occupancy Buildings (MOBs), REPEX diversions, and several technically assessed and bespoke areas that received no ex ante allowance in the DDs (e.g. Tier 1 iron stubs, Gas Safety Installation and Use Regulations’ disconnections and robotic interventions).
OE and RPEs
Ofgem has maintained its OE target of 1% per annum. While the CMA recently proposed a 0.7% target in its PR24 PD,29 Ofgem has expressed reservations regarding the CMA’s analysis, particularly its assessment of the comparability of productivity growth in the water sector to the broader economy. Ofgem notes that the CMA’s approach is novel and that its findings are provisional and subject to change.
The approach taken by Ofgem and its independent consultants has seen minor adjustments to the DDs, such as recognising that the most recent business cycle should include the Global Financial Crisis years of 2008 and 2009. However, neither these adjustments, nor the CMA’s analysis have prompted a change from Ofgem’s original 1% target.
Regarding RPEs, Ofgem’s proposed approach to managing risk in T3 is largely unchanged from the DDs position: in particular, it continues to use ex ante indices and weights to automatically adjust cost allowances over the control period. However, Ofgem has proposed some changes.
A key change relates to the use of a time profile of cost category weights to reflect forecast changes in the composition of companies’ expenditure in each year, aiming to provide more accurate annual adjustments to allowances. However, no adjustments will be made during the control period for the actual outturn expenditure composition.
Ofgem has confirmed that RPEs will be applied to re-openers where the typical project is a network infrastructure investment with construction phases spanning three or more regulatory years. Ofgem has also included two new asset-based indices in the mechanism for ETOs, and removed a previously proposed timber index for GDNs.
TIM
TIM has single sharing factors in both GT and GD of 39% and 50% respectively (which were the same in the DDs), but a stepped approach in ET. The stepped approach has changed slightly between the DDs and FDs as described below.
The proposed RIIO-ET3 TIM sharing factors are in the range of 5–25%, depending on the scale of overspend and underspend.
- On the first 5% of any overspend or underspend, ETOs would bear 25% of an overspend and, symmetrically, retain 25% of any underspend.
- For overspend or underspend falling between 5% and 20%, the ETO will still bear 25% on the first 5% of overspend or underspend, but only 10% of any overspend and underspend for deviations beyond the first 5%. This is a change from the DDs, where the window of overspend subject to a smaller sharing percentage was from 5% to 15%, and any overspend in this range received a 5% sharing rate rather than a 10% sharing rate.
- For any overspend and underspend beyond 20%, the step rules described above will still apply, with any overspend or underspend beyond 20% to be given a 5% sharing rate, rather than a 0% sharing rate above any 15% overspend proposed in the DDs.
The impact on RoRE for the three ETOs on average is illustrated in the chart below. If one assumes that ETOs perform at the level of TOTEX submitted in their business plans, each of them would experience 0.9–1.1% of RoRE underperformance under the TIM set in the FDs.
Figure 4 Impact of TOTEX overrun on RoRE under RIIO-ET3 DDs and RIIO-ET3 FDs TIM
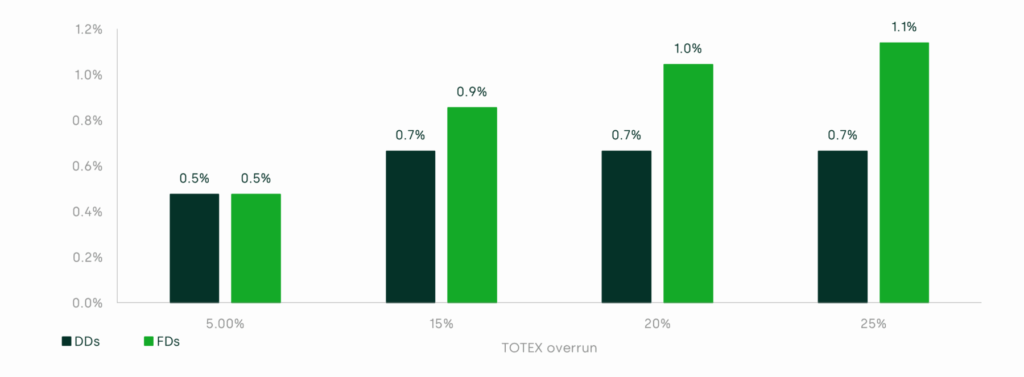
Source: Ofgem (2025), ‘RIIO-3 Final Determinations: Company Specific Annexes’, 4 December; Ofgem (2025), ‘RIIO-3 Draft Determinations: Company Specific Annexes’, 1 July; Ofgem (2025), ‘RIIO ET3 PCFM_Final Determinations_Dec25.xlsx’.
Conclusions
Networks will now assess whether the allowances are sufficient for them to deliver their obligations effectively and whether they can raise necessary debt and equity finance to fund the planned levels of investment, given the level of costs that Ofgem has allowed to be recovered from customers. Companies have the right to appeal their determinations to the CMA. The deadline for appeals will depend on when the licence modification decisions are published, but as a guide, the RIIO-2 Notices of Appeal were filed on 3 March 2021, following publication of RIIO-2 FDs on 8 December 2020 and licence modification decisions on 3 February 2021.
Footnotes
1 Ofgem (2025), ‘RIIO-3 Final Determinations for the Electricity Transmission, Gas Distribution and Gas Transmission sectors’, 4 December, https://www.ofgem.gov.uk/decision/riio-3-final-determinations-electricity-transmission-gas-distribution-and-gas-transmission-sectors (accessed 4 December 2025). See Oxera’s review of Ofgem’s RIIO-3 Draft Determinations (DDs) at Oxera (2025), ‘Ofgem RIIO-3 Draft Determinations’, 4 July, https://www.oxera.com/insights/agenda/articles/ofgem-riio-3-draft-determinations/ (accessed 4 December 2025).
2 Ofgem (2025), ‘RIIO-3 Final Determinations Overview Document’, 4 December, p. 7.
3 CMA (2025), ‘Water PR24 references. Provisional Determinations – Summary’, 9 October.
4 See Table 2 for details.
5 Scottish Power Transmission (SPT).
6 The outcome of Stage A, which assesses whether business plans meet minimum requirements, has remained unchanged, with no companies receiving penalties.
7 Ofgem (2025), ‘RIIO-3 Final Determinations – Finance Annex’, 4 December, paras 9.14–9.15.
8 National Grid Electricity Transmission (NGET).
9 Scottish Hydro Electric Transmission (SHET).
10 Ofgem (2025), ‘RIIO-3 Draft Determinations – Finance Annex’, 1 July, paras 3.1–3.145.
11 Ofgem sets a 6.8% lower bound (ex-ante) and a 6.9% upper bound (ex-post), adopting a TMR of 6.9% as the rounded midpoint.
12 Ofgem (2025), ‘RIIO-3 Final Determinations – Finance Annex’, 4 December, paras 3.55–3.119.
13 Ofgem (2025), ‘RIIO-3 Final Determinations – Finance Annex’, 4 December, paras 5.1–5.69.
14 Ofgem (2025), ‘RIIO-3 Final Determinations – Electricity Transmission’, 4 December, Table 3. Ofgem’s BPFMs provide induvial estimates for each company which differ from the headline numbers in the ET annex. We use the average of the BPFM estimates for the sector-wide numbers in the table.
15 Ofgem (2025), ‘RIIO-3 Final Determinations – Electricity Transmission’, 4 December, Table 3.
16 Ofgem (2025), ‘RIIO-3 Final Determinations – Electricity Transmission’, 4 December, p. 68.
17 Ofgem (2025), ‘RIIO-3 Final Determinations – Electricity Transmission’, 4 December, Table 3.
18 The FDs ranges shown in Table 2, which are derived from Ofgem’s model (RIIO ET3 BPFM_Final Determinations_Dec25) and aligned with the graphical representation in the FDs finance annex (Figure 4: Illustrative RoRE ranges, RIIO-ET3 average), differ from those published in the FDs ET annex (Table 3: Overview of financial incentives in RIIO-ET3). Table 3 of the FDs ET annex shows a broader range for total ODI-F, with an upside of 4.84% and a downside of -2.73%, compared to the range presented in Table 2. Additionally, when comparing the risk ranges in the DDs and FDs, it should be noted that Ofgem’s DDs RoRE modelling (RIIO ET3 BPFM_Draft Determinations_Jun25) did not include major projects.
19 National Gas Transmission (NGT).
20 Ofgem (2025), ‘RIIO-3 Final Determinations – Electricity Transmission, 4 December, Tables 21–22; Ofgem (2025), ‘RIIO-3 Final Determinations – National Gas Transmission’, 4 December, Table 6.
21 For simplicity, here and in the remainder of the cost assessment sections, we compare Ofgem’s FDs with the original DDs publication, without considering subsequent DDs corrections.
22 Ofgem (2025), ‘RIIO-3 Final Determinations – Electricity Transmission’, 4 December, paras 5.74–5.141.
23 Ofgem (2025), ‘RIIO-3 Final Determinations – Electricity Transmission’, 4 December, para. 5.108. For more insight into the implications of the Independent Water Commission’s review of the water sector, see Oxera (2025), ‘The Independent Water Commission—implications for regulation’, Agenda, July.
24 Ofgem (2025), ‘RIIO-3 Final Determinations – Electricity Transmission’, 4 December, para. 5.122.
25 That is, taking the ratio of the £m total regional/company-specific factor adjustments and modelled regression costs reported in Tables 19 and 17, respectively, of Ofgem (2025), ‘RIIO-3 Final Determinations – Gas Distribution’, 4 December.
26 Tier 1 mains are the highest priority mains, mandated to be replaced by the iron mains risk reduction programme by the Health and Safety Executive (HSE), in a given period.
27 As part of the HSE’s mains replacement programme, existing iron mains already in the ground (those to be decommissioned or abandoned) are replaced by new polyethylene (PE) mains that are often inserted within the existing mains. The new PE mains are thus commissioned (or ‘lay’). The lay-to-abandon ratio refers to the size or volume of newly commissioned mains, often of a smaller size, relative to the old mains that they are replacing.
28 This entails two adjustments: (i) for where GDNs had forecast different lay-to-abandonment conversion profiles across different diameter bands and (ii) had different lay-to-abandon ratios in total.
29 CMA (2025), ‘WATER PR24 REFERENCES Provisional Determinations – Summary’, 9 October, para. 61.
Download
Contact

Elizaveta Kovaleva
Managing ConsultantContributors
Related
Download
Related

Access to land for mobile telecoms networks: a framework for negotiation and regulation
Mobile towers serve as the backbone of mobile telecoms networks, hosting radio access network equipment that enables us to receive calls, texts and to access the internet on our mobile devices. In turn, the ability of the builders of mobile towers to access land—whether that is on the ground,… Read More

What is venture capital, how does it work, and what are the risks?
In the third and final episode demystifying private equity, we explore the world of venture capital. While venture capital has delivered exceptional returns for some investors and founders, it’s also very high risk. So, is vibrant venture capital essential for economies seeking to boost innovation and drive productive growth? In… Read More