
Regulation and policy in Italy: don’t throw away the baby with the bath water!
The Italian water sector is undergoing a period of significant change. The sector does not require radical intervention in its ownership structure to improve investment levels and quality standards, but rather a package of measures to improve the management model and enhance independent regulation. How can tariff regulation be extended nationwide, and how can existing industry fragmentation be overcome?
The note is a summary of an upcoming article by Alfredo Macchiati, Pierpaolo Perna, Francesco Tucci, Organizzazione E Politiche Pubbliche Nel Settore Idrico, Mercato Concorrenza e Regole.
Compared with other European countries, Italy faces significant challenges in terms of its level of water losses, wastewater treatment and quality of customer service (as shown in Table 1). The policy objectives of the Italian water sector need to address the origins of this gap.
Table 1 Comparison of quality standards and prices
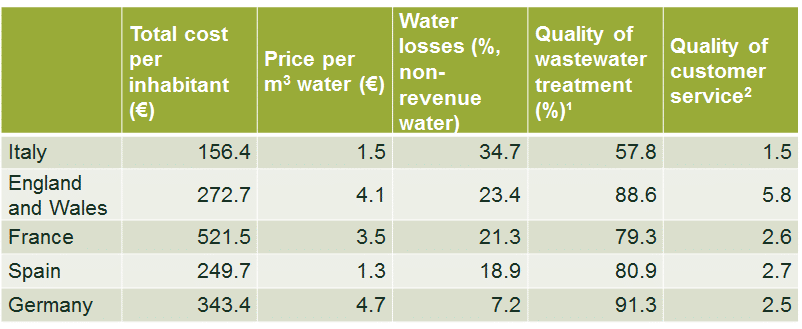
Source: Global Water Intelligence (2018), ‘International Comparisons of Water Sector Performance’. Data refers to the period 2011–17.
Italy’s performance is due primarily to underinvestment in infrastructure. Looking at the most recent data, planned investment for the period 2016–19 amounts to around €59 per inhabitant per year (for the so-called industrial operators).1
This puts Italy below the European average: Belgium, Germany, the Netherlands, the UK and France achieve per-capita investment levels of between €80 and €150 per year.2 Given investment levels of around €59 per capita and assuming an overall investment need of €80 per capita, the current gap in investment spending is around 27%.
Low investment seems to be associated in particular with ‘in economia’ management—in which the water service is administrated directly through a department of the municipal public administration, a model that is more widespread in the south of the country. Indeed, for this type of management, investments are as low as €4 per capita in the South and €7 per capita in the Centre and North.3
In Italy, the principle of cost-reflective tariffs was introduced relatively recently.4 The introduction of independent regulation in the water sector, and the assignment of the related responsibilities to an Authority (ARERA) in 2011, have brought beneficial effects on the level of investments. Per-capita investments increased from around €34 in 2012 to €59 (2016–2019 average), a rise of 73%.5
In other words, what appears to be the current relatively low performance in quality standards may reflect a legacy of the past (i.e. the lack of independent regulation) and the incomplete application of the 2011–12 tariff reform to the entire Italian territory—rather than its lack of effectiveness.
Another issue in the sector is its large number of operators (2,551,6 of which 2,217 are ‘in economia’), which is linked to the issue of scale economies. The optimal efficient scale is a topic that has undergone plenty of discussion and analysis. With reference to the Italian market, Guerrini and Romano (2011)7 report evidence of economies of scale for companies of between 50,000 and 250,000 users, while Guerrini, Leardini and Romano (2018) show that economies of scale are more likely to be present below 50,000 users than in the size range between 50,000 and 150,000 users.8 Moreover, recent econometric analysis using a panel dataset for the period 2014–17 confirms that economies of scale exist in the sector.9
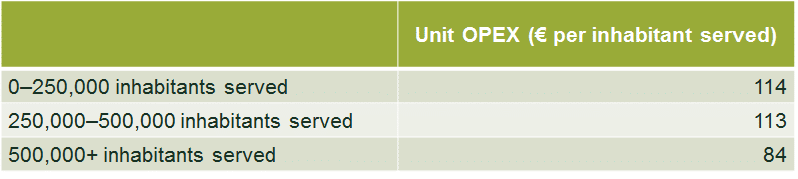
High-level analysis based on operating expenditure (OPEX) levels shows how OPEX per capita remains largely stable up to 500,000 inhabitants served, and subsequently drops by almost 25% (as shown in Table 2).
Table 2 OPEX levels and firm size (2016)
ARERA has intervened in the issue. For example, the regulator has introduced targeted measures within the tariff system, which mean a less stringent cap on tariff growth in the event of consolidation. However, despite some promising results (the number of operators was 2,900 in 2012),10 the positive effects appear to be tailing off.
Ownership and management models
In the Italian policy debate, public ownership has been raised as a possible solution to the sector’s difficulties. This appears to be in line with a European political and cultural climate that is moving towards an enhanced role for municipalities in organisational and ownership structures.11
Given these developments, it is useful to bear in mind the consequences of an increase in the local political sphere on water activities in Italy. Economic theory presents several arguments stressing the inefficiency of direct public management in regulated sectors (such as water networks) and in the presence of loose regulatory regimes.12 A more controversial issue among regulatory experts is the issue of the cost of debt, which some authors suggest is lower for the public sector.13 Others have argued, however, that ownership structure has no effect on financing costs.14
In two recent instances of nationalisation, in Paris and Berlin, it is possible to observe the following.
- The respective national legal frameworks have maintained flexibility in the choice of ownership model. Renationalisation was not imposed by a national law but was carried out by local authorities.
- In both cases, the nationalisation was not achieved through the forced termination of existing concessions.
- In the case of Paris, public management took over when the concession expired, whereas in the case of Berlin, this took place through the acquisition of a company share, which came at a cost for local communities.15
These two cases suggest that municipalisation processes have acquisition costs that may vary from case to case, and they may be significant.
Finally, public ownership arguments appear to ignore recent contributions that provide a different view of the purpose of companies, by abandoning the principle of exclusive maximisation of profit and prioritising shareholder interests.16 There may be more or less radical instruments for achieving this. For example, a stated ‘corporate purpose’ may be included in the company statute or in the concession contract.17 In practice, the statute could state (for example) that the purpose of the company is to maintain and improve adequate quality standards, improve impacts on the environment, and involve and serve communities. Less radical instruments may also include incentive systems aimed at countering ‘short-termism’ (such as linking management’s remuneration structure to social responsibility objectives and long-term profits). Finally, a greater degree of public participation in decisions, for example in relation to investment choices, can also be introduced regardless of ownership type. An example of the application of these various tools is the developing regime being implemented in England and Wales by the regulator (Ofwat) and the water industry.18
Italy’s listed multi-utility companies: a success story?
In Italy, most of the largest operators are organised according to a model that emerged around 20 years ago—that of large listed mixed-ownership multiutilities, such as Iren, Hera and Acea. These coexist with a limited number of companies of significant size that are owned entirely by local authorities.19
Listed multiutilities represent a successful combination of public presence, private management, local roots, the presence of market investors and transparency, and display positive results in terms of investments and quality of service (as shown in Table 3, for example, with reference to water losses).
Table 3 Evolution of water losses for a sample of operators

In addition, some of these companies include in their corporate mission a reference to social needs and objectives, together with the promotion of the socioeconomic development of the community in which they operate.20 This type of company might be said to represent an ‘Italian model’ for water management, as shown by its numerous plaudits in terms of environmental sustainability and governance.21 It would therefore seem sensible to strengthen this paradigm in terms of sustainable finance and consumer control, and potentially extend it to other local areas.
Catching the baby?
The causes of the infrastructure gap in the Italian water sector provide a clear indication of the real public policy priorities.
In addition to strengthening the role of the regulator with regard to investment monitoring and consolidation, it is important to strengthen the traditional link between water services and local communities. This could be done by encouraging new governance models that incorporate user preferences and service quality improvements in business objectives. In Italy, the mixed ownership model, with its sufficient industrial scale, appears most suitable to take up these challenges.
1 ARERA (2019), ‘Relazione Annuale. Stato dei servizi’, March. Areas in which the water service is operated under ‘in economia’ management are excluded.
2 Utilitatis (2019), ‘Blue Book’, January.
3 Utilitatis (2018), ‘Rapporto Sud’, p. 68.
4 Bardelli, L. (2016), ‘The strange case of water regulation in Italy’, Agenda, April.
5 ARERA (2019), ‘Relazione Annuale. Stato dei servizi’, March, p. 356.
6 Utilitatis (2019), ‘Blue Book: Data on Integrated Water Service 2019’, October.
7 Guerrini, A. and Romano, G. (2011), ‘Measuring and comparing the efficiency of water utility companies: A data envelopment analysis approach’, Utilities Policy, 19, pp. 202–209.
8 Guerrini, A., Leardini, C. and Romano, G. (2018), ‘Economies of scale and density in the Italian water industry: A stochastic frontier approach’, Utilities Policy, 52, pp. 103–111. The study excludes multiutility providers and concentrates on small and medium-sized enterprises (only about ten have more than 500,000 users).
9 The sum of the coefficients relative to the scale variables (volumes, network length, service population, equivalent inhabitants) estimated in the model is less than one. ARERA (2019), ‘Consultation document 402/2019/R/IDR’, October, Table 4.
10 Bardelli, L. (2018), ‘Italian water regulation: a changing scene’, Agenda, August.
11 For example, see Labour Party Manifesto 2017, ‘For the many not the few’, section ‘Widening ownership of our economy’, May; Department for Environment Food and Rural Affairs (2017), ‘Letter 1: from the Secretary of State to the Chair of Ofwat’, 31 January; Financial Times (2019), ‘Water renationalisation to cost as little as £14.5bn; Moody’s calculation far lower than industry-backed estimate of up to £90bn’, 26 April; Social Market Foundation (2018), ‘The cost of nationalising the water industry in England’, February. Transnational Institute (2014), ‘Here to stay: water remunicipalisation as a global trend’, November.
12 Shleifer, A. (1998), ‘State versus Private Ownership’, Journal of Economic Perspectives, 12:4, pp. 133–150.
13 Position initially put forward in Arrow, K. (1965), ‘Criteria for Social Investment’, Water Resources Research, 1:1, March, pp. 1–8.
14 Brealey, R.A., Cooper, I.A. and Habib, M.A. (1997), ‘Investment appraisal in the public sector’, Oxford Review of Economic Policy, 13:4.
15 For the Berliner Wasserbetriebe (BWB) case see, for example, Transnational Institute (2014), ‘Remunicipalisation in Berlin after the buy-back: from de-privatisation to demands for democratisation’, June. For Paris, see CIRIEC (2018), ‘Water remuncipalisation in Berlin and Paris: Specific processes and common challenges’, August.
16 See Mayer, C. (2018), Prosperity: Better Business Makes the Greater Good, Oxford University Press; Rajan, R. (2019), The Third Pillar, The Revival of Community in a Polarised World, William Collins; Oxera (2019), ‘Beyond the Bottom Line’, September.
17 Mayer, C., op. cit.
18 See Oxera (2019), ‘A challenging initial assessment for the water companies in England and Wales’, Agenda, February; and Ofwat (2019), ‘Speech from Rachel Fletcher: Regulators and the social contract’, October.
19 The largest operator in this category is Acquedotto Pugliese, followed by Smat and Cap Holding.
20 See the Hera Group Statute as an example.
21 See Acea (2018), ‘Sustainability Report’, pp. 132 and 167; Iren (2018), ‘Sustainability Report’, pp. 55–56; and Hera (2018), ‘Sustainability Report’, p. 8.
Download

Related

No water, no growth: tackling inefficient business water demand
Water is not typically thought of as a constraint on economic growth in England. Yet that is precisely what it is becoming. Commercial growth and new developments are being turned away because there is insufficient water to serve them. Some water companies are already exercising their powers to refuse… Read More

The energy trilemma in focus: the price of dependence
Europe’s approach to energy policy has been in transition since the 2022 energy crisis laid bare the continent’s dependence on imported fossil fuels. More recently, the outbreak of war in the Middle East and the subsequent disruption to global oil and gas markets have caused further challenges. This article… Read More