
Left out in the cold? The UK cost-of-living crisis
Surging oil and gas prices, coupled with climbing food costs, are weighing heavily on many economies. While this is a challenge for countries as a whole, the cost-of-living crisis is affecting different parts of society in different ways. Taking the example of the UK, we dig into the data and explore how households up and down the country and across income groups are faring with recent inflation, and discuss what public policy is doing to help. There is no perfect solution to the perfect storm—and there remain a number of unanswered questions.
Several factors have converged to produce particularly high inflation in the UK. First, the initial COVID-19 lockdowns resulted in supply-chain disruptions—leaving higher prices and less variety in terms of available goods in their wake.1 The pandemic has also led to workers leaving the labour market, reducing the supply of labour—in particular, young workers aged 18–24 and older workers aged 65+.2 Second, Russia’s invasion of Ukraine in February 2022 has restricted the supply of gas and grain shipments, resulting in higher energy and food prices.3
Finally—and what could set the UK’s inflationary path apart from those of EU member states—there is Brexit. A recent study finds that, following the 2016 referendum, the weakening of sterling raised the price of imported products, increasing UK consumer prices by 2.9%.4 The UK subsequently left the EU in January 2020—resulting in new tariff and non-tariff trade barriers while ending freedom of movement of EU workers to the UK. Adam Posen, former External Member of the Monetary Policy Committee of the Bank of England, argues that—in the face of a common supply shock across Europe—these restrictions have magnified this shock for the UK, resulting in higher inflation than in EU countries.5
Rising wholesale energy costs have left their mark on the energy supply sector in the UK. Customers on default tariffs are protected by a retail price cap. However, in the face of spiralling wholesale energy costs and capped retail charges, a number of energy retailers have become insolvent over the past year. To address this, in April 2022 Ofgem, the energy regulator for Great Britain, raised the price cap that suppliers can charge customers on default tariffs from £1,277 to £1,971 per year—an increase of £693 (or 54%). Ofgem also reduced the interval between cap revisions from six to three months.6 In May, Ofgem predicted that the cap could rise further to £2,800 in October 2022.7 Since then things have got worse: the actual cap was announced on 26 August and will be £3,549 from 1 October.8
To support households, in May the UK government announced a £400 discount on all households’ energy bills, paid for by the government. The support package, which also includes a £150 rebate for homes in council tax bands A–D, is broad. The energy discount is universal while the tax rebate covers c. 80% of households.9
The cost-of-living crisis will be high on the agenda for the next Prime Minister and Chancellor of the Exchequer. Research shows that poorer households spend a greater share of their disposable income on necessities such as food, housing and bills.10 This means that different inflation rates across spending categories can exacerbate differences in living standards between different income groups.
While all income groups may cut back on their discretionary spending, such as eating out, it is poorer households that are forced to make difficult choices between, for example, paying for heating and buying food. At present the UK is experiencing a hot summer, but the crunch time will come in the winter when households may face particularly stark choices.
Inflation: what’s going up?
Figure 1 shows CPIH inflation (the consumer price index including housing costs) for electricity, gas and other domestic fuels compared with a number of major spending categories between 2016 and May 2022. Particularly severe is the rise in electricity and domestic fuel prices since the start of the war in Ukraine. Transport prices are also rising rapidly, as the gas shortage has increased the price of petrol, and also because of staff shortages. This contrasts with a rate of CPIH inflation that was relatively even across categories before 2019.
Figure 1 CPIH for electricity, gas and fuels
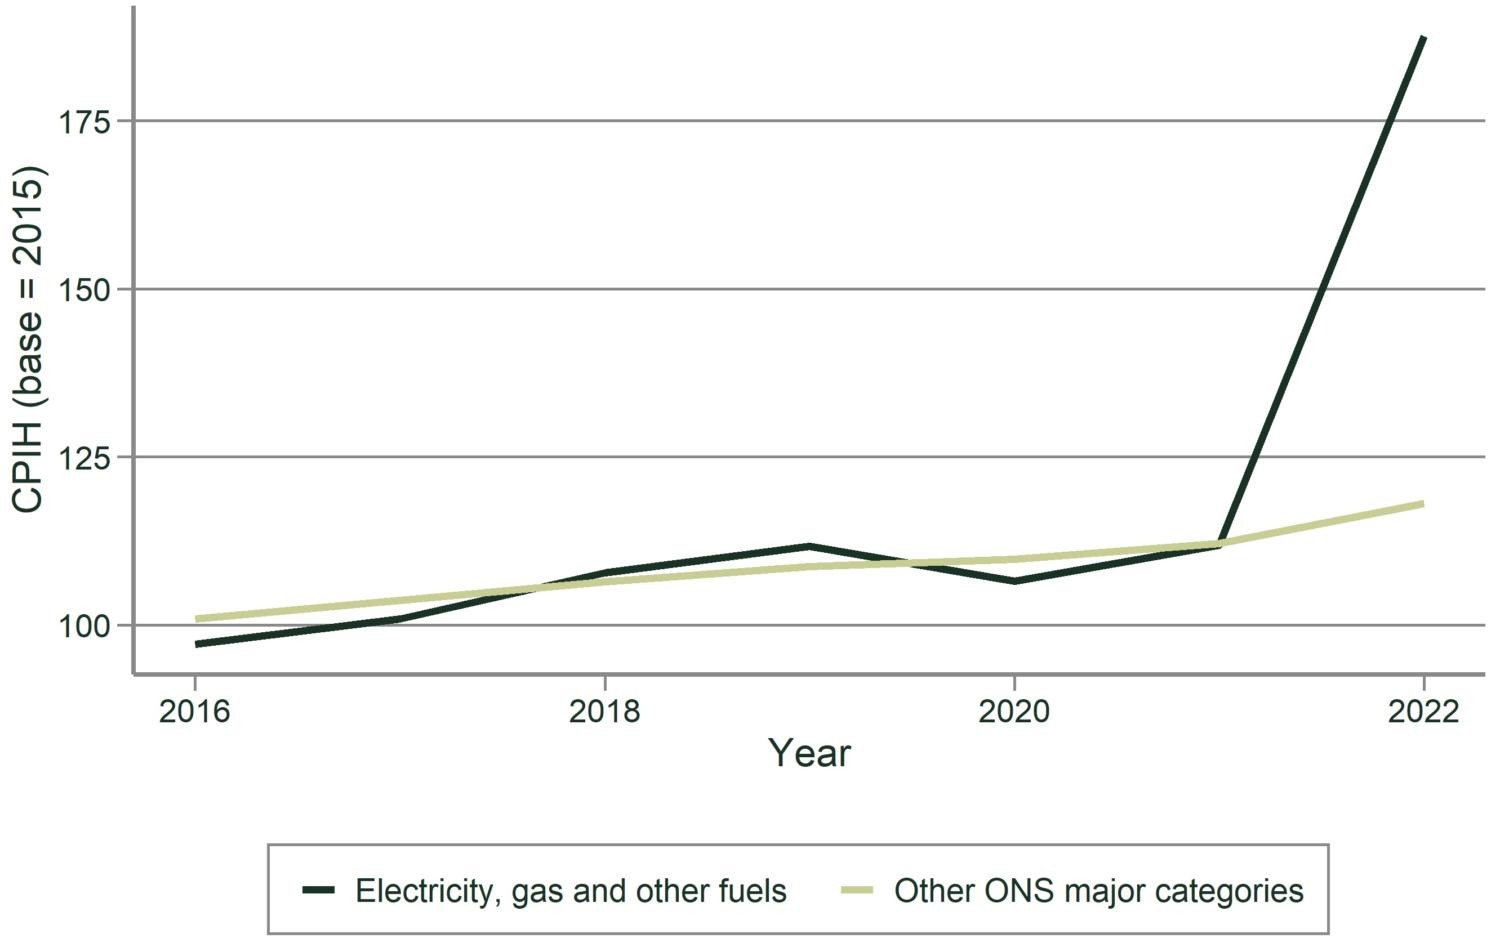
Source: Office for National Statistics (2022), ‘Dataset: Consumer Prices Index including owner occupiers’ housing costs (CPIH)’, 20 July (last accessed 7 July 2022).
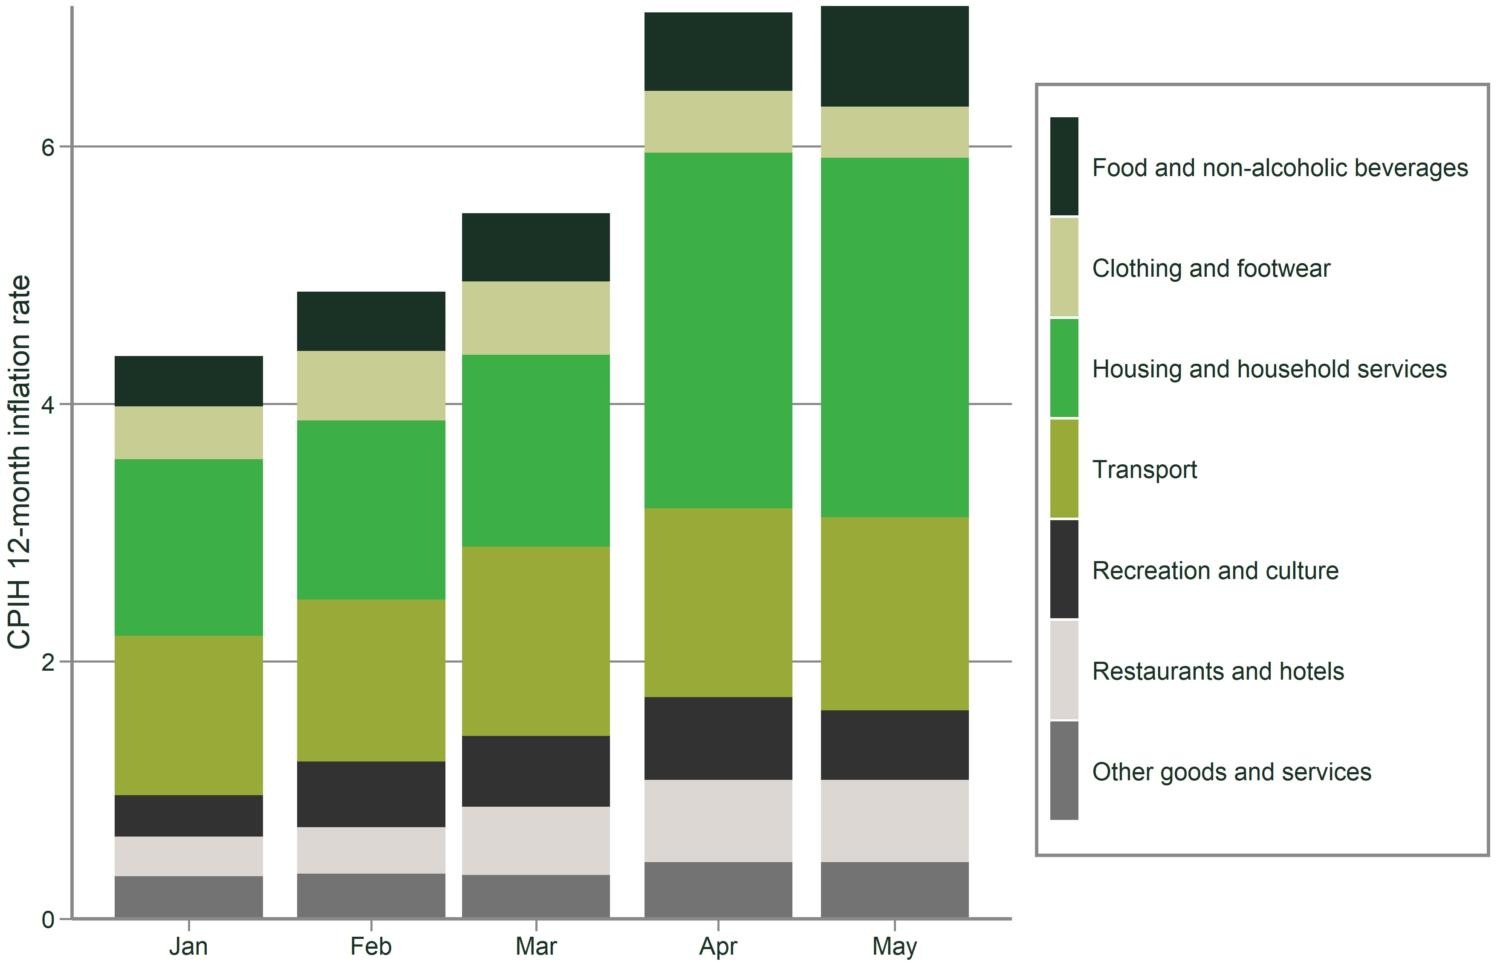
Data from the UK Office for National Statistics (ONS) shows that CPIH rose by 7.9% in the 12 months to May 2022, up from 7.8% in the 12 months to April. The largest upward contributions to the inflation rate in May 2022 came from housing and household services (2.79 percentage points, principally from electricity, gas and domestic fuels, and owner occupiers’ housing costs) and transport (1.50 percentage points, principally from motor fuels and second-hand cars).11
In the same storm, but not in the same boat
ONS data shows significant differences across income deciles for certain spending categories. Figure 2 presents the percentage share of weekly expenditure across six item categories between 2016 and 2019—a period of relatively low inflation. Over the period, households in the bottom half of the income distribution spent significantly more on housing and utilities than their higher-income counterparts.
On average across the four years, more than 30% of spending among those on very low incomes went towards housing and utilities. In contrast, the richest tenth of households spent around 20% of their income on these (note that this does not account for any differences in the size or quality of housing). Similarly, food and drink made up a larger budget share among low-income households—14%, compared with 8% among the top tenth. Conversely, spending on transport constituted a larger share among high-income households.12
Figure 2 Share of weekly spending by item and income decile
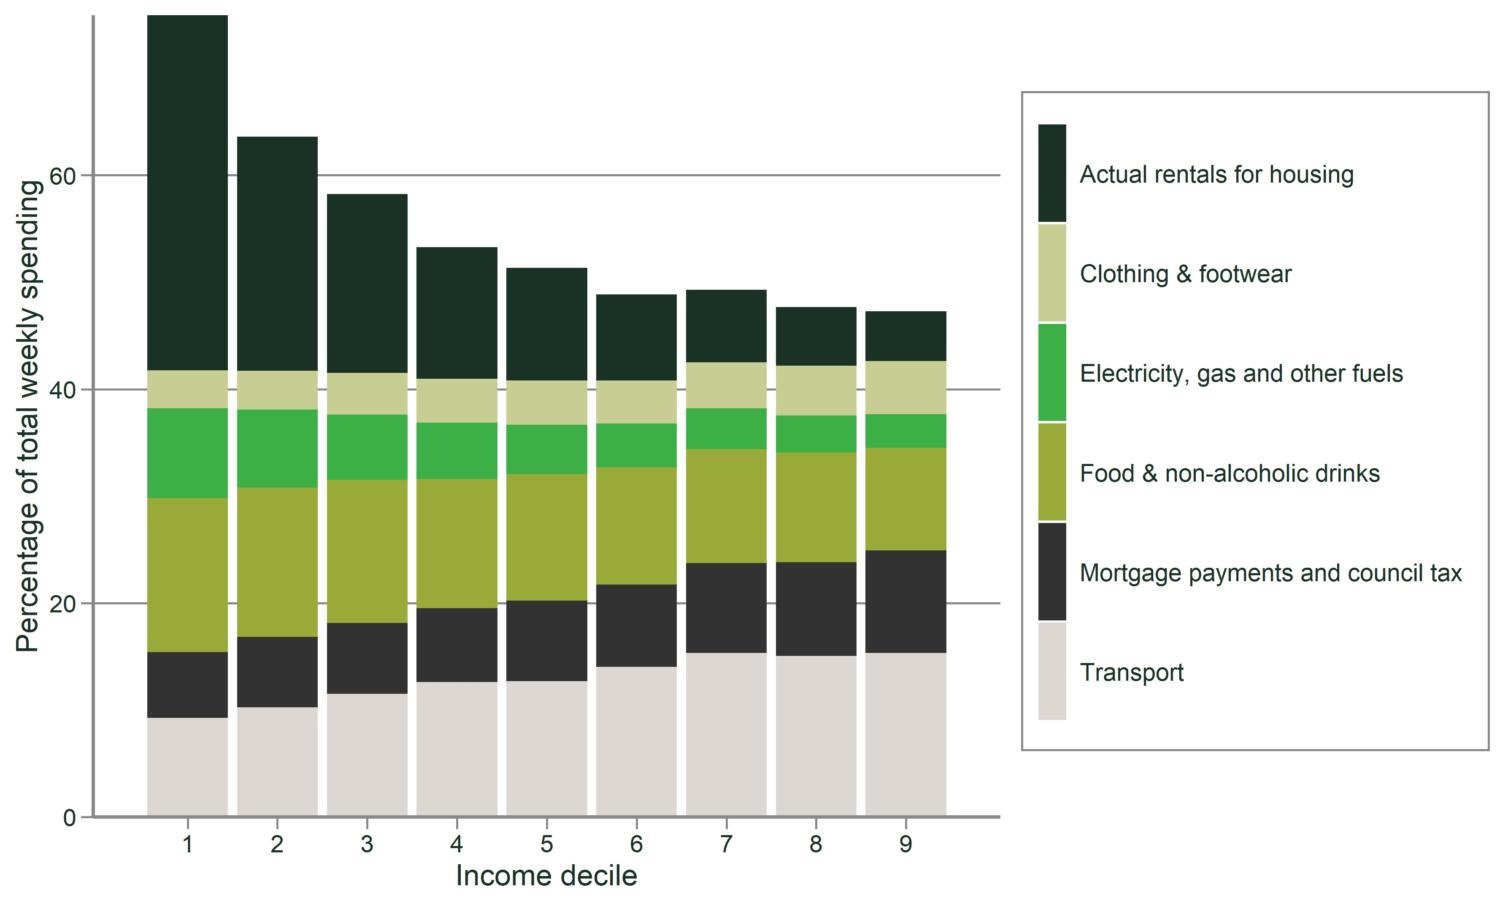
Source: Office for National Statistics (2019), ‘Dataset: Household expenditure as a percentage of total expenditure by gross income decile group: Table A5’ (last accessed 30 August 2022).
Electricity, gas and other domestic fuels represented a higher share of spending (8.4%) for low-income households. Low-income households were therefore always particularly vulnerable to rising energy prices and—with the rapid increase in energy costs over the past year—such households are spending an even greater share of their income on such essentials (see below for a discussion of more recent developments).
Regional perspectives
UK households experience different costs of living depending on where they live. Urban households typically spend proportionally more on rent and transport services. Rural areas instead have higher heating costs on average, as many households do not obtain gas from the grid due to their distance from the gas network. As a consequence, rural consumers are more likely to use heating fuels that are not based on mains gas. Rural populations also drive more and longer distances, and are therefore more exposed to inflation in petrol and diesel.13 Sudden and severe price inflation for specific items can therefore also exacerbate urban/rural disparities.
Figure 3 shows that Greater London is an outlier in terms of the share of household spending that goes towards rent. Homeowners face a different reality. Figure 3 also shows that, despite the capital’s high property prices, mortgage payments do not make up a significantly larger share of spending in London vis-à-vis other regions. Northern Ireland and the South West—including cities such as Bath, Bristol and Exeter—have the highest shares at 11–12%. Owners in London have seen the value of their properties outstrip their mortgages in an economy with historically low interest rates and rising house prices.
Figure 3 Share of total spending (%) towards rent and mortgage payments by region

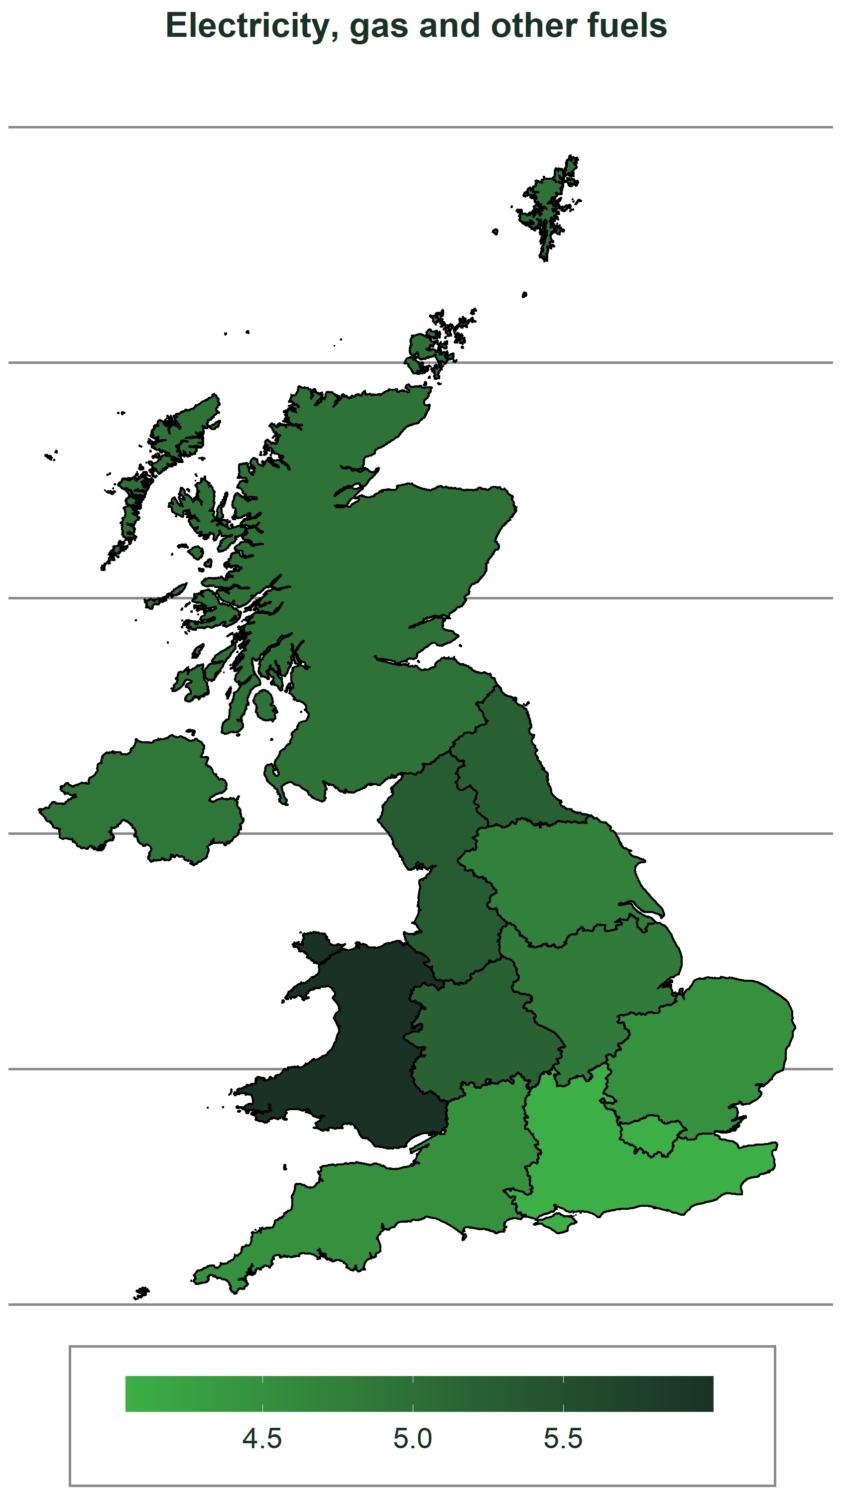
The share of weekly expenditure going towards electricity, gas and other domestic fuels, shown in Figure 4 below, is similarly relatively low in London at 4%, rising to 5–6% in the north of England and Northern Ireland. This is because London dwellings are generally smaller and consume less energy, while winters are milder in the south of the country.
In summary, the regional data shows that rural and suburban households are more sensitive to rising fuel prices, while rising rents is a stressor for urban households as they are more likely to rent their home (particularly in London, where home ownership in lower income groups is especially low).
Figure 4 Electricity and fuel spend shares by region
Struggling to pay
Increasing energy costs leave less disposable income for other expenses, particularly among lower income groups. This can push households into challenging economic circumstances.
Even as early as March 2022, an Ofwat survey of around 2,300 water customers in England and Wales revealed that half of them had already struggled to pay one or more household bills ‘sometimes’ or more often over the previous year. The findings showed that more customers were struggling with bills than in late 2021. Of these, 12% of respondents reported struggling with household bills ‘all of the time’ or ‘most of the time’. The proportion who reported never struggling with a bill fell from 44% in late 2021 to 31% in March 2022. Younger people were more likely to report struggling with bills all or most of the time (34%), as were those who had children under 18 living at home (35%).14
More recent research in August 2022 by price comparison site Uswitch finds that household energy debt now stands at an all-time high of £1.3bn—nearly three times higher than it was in September 2021. While a similar proportion of people are in debt as in April 2022, they now owe 10% more to their energy providers.15
This is perhaps not surprising. Figure 5 shows how 12-month CPIH inflation has accelerated for the lowest 10% income decile over the course of 2022. At the same time, the proportion of income spent by this group on housing and household services (including utility bills) has risen.
Figure 5 Spending shares over time among the lowest 10% of incomes
Source: Office for National Statistics (2022), ‘Dataset: Family spending workbook 1: detailed expenditure and trends’, 18 July (last accessed 30 August 2022).
What solutions have been proposed?
The cost-of-living crisis in the UK presents the government with difficult decisions. In late May the (then) Chancellor of the Exchequer Rishi Sunak announced a £15bn Cost of Living Support package—including payments of £1,200 to those on the lowest incomes (about a third of all households). This comprises:16
- a £650 cost-of-living payment to households that are on means-tested benefits (in two instalments, paid in July and the autumn);
- a £400 discount on energy bills, paid to every household over six months as a universal cash grant, which will not be recovered through higher bills in future years (from October);
- £150 from the council tax rebate for eligible households (applied in April).
The support package will be funded through an Energy Profits Levy—a new 25% windfall tax on profits made by North Sea oil and gas producers. The prediction was that this would raise around £5bn over the first year (from May 2022 onwards). As a sweetener, a new 80% Investment Allowance will double the tax relief available when oil and gas companies invest in the sector.17
It is less clear that a windfall tax will be extended to electricity generation—as was recently mooted by the former Chancellor.18 Meanwhile, the government is exploring reforms that would decouple electricity prices from those of gas.19
In contrast to the Conservative administration, the opposition Labour party has said that it would introduce a six-month freeze on energy prices, at current levels, from October onwards. To fund this and other measures it would apply the windfall tax to profits from January 2022 rather than May, taking the expected amount raised by the windfall tax to £8bn.20
The situation is very fluid. In late July Rishi Sunak proposed another measure—if he becomes Prime Minister in the current leadership contest, he would temporarily remove the 5% VAT currently charged on household energy bills for 12 months from October if the energy price cap rose above £3,000.21 The plans of leadership rival Liz Truss are less clear at this stage—at least beyond newspaper reports. whoever is announced as the winner of the leadership race on Monday 5 September will need to set out a definitive way forward.
The issue is that any measure has its advantages and drawbacks. There is always a question about the effectiveness of such measures in targeting the most vulnerable groups without rewarding those who can afford to pay—the targeted cost-of-living payment achieves this, while the universal £400 discount applies to all households, for example. The current support measures were also drawn up in May, when the cap was expected to be £2,800 in October—as opposed to the £3,549 that will now be applied. Research firm Cornwall Insight predicts that the price cap could rise to over £4,260 in January.22
Then there is the question of how this should be funded—and whether the imposition of a windfall tax stores up problems for future investment decisions. Is the price cap regime fit for purpose? In addition to their current support measures, what should energy suppliers be doing to help customers who get into payment difficulties? Which longer-term structural measures could help to lessen the burden on consumers and the taxpayer?
No clear path ahead?
Several factors have converged in 2021 and 2022 to produce high inflation. In particular, the prices of electricity, domestic fuels and transport have risen dramatically. In the UK, the ONS spending data shows that the proportion of these items in households’ budgets differs by income, with the poorest households being particularly affected.
A larger share of spending among low-income households goes towards rent, food, electricity and other utilities. There is evidence that this share has increased over time, especially for lower income groups. Further inflation out of line with wage growth will exacerbate this problem.
There is no perfect solution to the perfect storm—and there remain a number of unanswered questions. Policy will need to be clearly set out by the new Prime Minister and their chancellor. In the short term—as a priority—there are the winter months to contend with. In the longer term the UK government will need to consider what reforms are needed to energy market design and regulation.
1 Jaravel, X. and O’Connell, M. (2020), ‘Real-time price indices: Inflation spike and falling product variety during the Great Lockdown’, Journal of Public Economics, 191, p. 104270.
2 See Office for National Statistics (2022), dataset A05 SA ‘Employment, unemployment and economic inactivity by age group (seasonally adjusted)’, 17 May; as discussed in Powell, A., Francis-Devine, B. and Clark, H. (2022), ‘Coronavirus: Impact on the labour market’, House of Commons Library, August.
3 Liadze, I., Macchiarelli, C., Mortimer-Lee, P. and Sánchez Juanino, P. (2022), ‘The Economic Costs of the Russia-Ukraine Conflict’, National Institute of Economic and Social Research Policy Papers, 32, 2 March (last accessed 6 July 2022).
4 Breinlich, H., Leromain, E., Novy, D. and Sampson, T. (2022), ‘The Brexit vote, inflation and U.K. living standards’, International Economic Review, 63:1, pp. 63–93.
5 Posen, A. and Rengifo-Keller, L. (2022), ‘Brexit is driving inflation higher in the UK than its European peers after identical supply shocks’, Peterson Institute for International Economics, 24 May.
6 Ofgem (2022), ‘Check if the energy price cap affects you’ (last accessed 2 August 2022); see also Ofgem (2022), ‘Price cap to increase by £693 from April’, press release, 3 February (last accessed 30 August 2022).
7 House of Commons (2022), ‘Business, Energy and Industrial Strategy Committee Oral evidence: Energy pricing and the future of the energy market’, HC 236, oral evidence of Jonathan Brearley, CEO, Ofgem, 24 May.
8 Ofgem (2022), ‘Ofgem updates price cap level and tightens up rules on suppliers’, press release, 26 August (last accessed 26 August 2022).
9 Institute for Government (2022), ‘Cost of living crisis: reducing energy bill costs’ (last accessed 2 August 2022).
10 Chai, A. and Moneta, A. (2010), ‘Retrospectives: Engel curves’, Journal of Economic Perspectives, 24:1, pp. 225–240.
11 Office for National Statistics (2022), ‘Consumer price inflation, UK: May 2022’, statistical bulletin, 22 June, p. 2 (last accessed 7 July 2022).
12 Office for National Statistics (2019), ‘Dataset: Household expenditure as a percentage of total expenditure by gross income decile group: Table A5’, 24 January (last accessed 6 July 2022).
13 Roberts, D., Vera-Toscano, E. and Phimister, E. (2015), ‘Fuel poverty in the UK: Is there a difference between rural and urban areas?’, Energy policy, 87, pp. 216–223.
14 Ofwat (2022), ‘Cost of living: Water customers’ experiences’, May (last accessed 7 July 2022).
15 Gallizzi, B. (2022), ‘UK households already owe £1.3 billion ahead of winter bill hikes’, Uswitch, 9 August (last accessed 31 August 2022).
16 HM Treasury (2022), ‘Millions of most vulnerable households will receive £1,200 of help with cost of living’, news story, 26 May (last accessed 31 August 2022); Conservative Party (2022), ‘We’re taking real action on the cost of living’, 27 May (last accessed 31 August 2022); HM Treasury (2022), ‘Cost of living support factsheet: 26 May 2022’, policy paper, updated 15 June (last accessed 31 August 2022).
17 HM Revenue and Customs (2022), ‘Energy (Oil and Gas) Profits Levy’, policy paper, 11 July (last accessed 31 August 2022); HM Treasury (2022), ‘Energy Profits Levy Factsheet – 26 May 2022’, policy paper, updated 15 June (last accessed 31 August 2022).
18 Rishi Sunak MP, (then) Chancellor of the Exchequer, House of Commons Treasury Committee, ‘Oral evidence: The cost of living’, HC 343, Monday 6 June 2022.
19 Kwasi Kwarteng MP, Secretary of State, Department for Business, Energy and Industrial Strategy, House of Commons Business, Energy and Industrial Strategy Committee, ‘Oral evidence: The work of the BEIS Department’, HC 529, Tuesday 28 June 2022.
20 Labour Party (2022), ‘Keir Starmer sets out Labour’s plan to address the Tory cost of living crisis’, 14 August.
21 See Institute for Fiscal Studies (2022), ‘Rishi Sunak’s proposal to temporarily remove VAT on energy bills’, 27 July.
22 Cornwall Insight (2220), ‘Price cap forecasts for January rise to over £4,200 as wholesale prices surge again and Ofgem revises cap methodology’, 9 August.

Related

The two realities of operations: how process mining could reshape regulation
There are two distinct realities operating simultaneously in all organisations: (i) the theoretical, represented by policy documents, flowcharts and training manuals; (ii)the practical, or what actually happens across systems and teams and the necessary workarounds needed when things go wrong. Process mining is a data-driven discipline designed to uncover… Read More

Oxera AI policy map – June 2026
For this fourth edition of the AI Policy Map,1 we have updated our database that tracks key national and supranational AI policy developments across the European Economic Area (EEA) and the UK. This curated collection brings together legal texts, strategy documents and other influential publications relevant to… Read More