
Discrimination in labour markets: how does the past affect the future?
A large body of academic literature has sought to explain why members of observably different groups fare so differently in the labour market. Theories of distaste towards certain groups, alongside ‘rational’ models of statistical discrimination, have attempted to explain the well-documented disparities in wages and employment rates that exist between those of different gender, race and nationality. In this article, Eduard Krkoska, Doctoral Candidate in Economics at the University of Oxford and former Oxera intern, explores how these theories interact with each other and develop over time.
It is no surprise that to this day gaps in wages and employment between members of observably different groups persist. Usually, these are reported in percentage terms, comparing the average pay or employment rate between those of different gender or race.1 Empirical economists have developed methods to decompose these differentials2 into an ‘explained’ and an ‘unexplained’ component—where the explained differential accounts for varying educational and occupational choices, and the unexplained component is usually thought to represent discrimination by employers.
Many open questions remain, and two will be the focus of this article. First, how and why do wage and employment differentials between groups evolve throughout workers’ life cycles? In other words, why are wage and employment gaps when workers start looking for their first job different from those when workers already have an observable history of past employment? Second, what effects of past discrimination might there be even when an individual is not discriminated against by their current employer?
Models of discrimination
Figure 1 displays the employment rates for the black and white populations of the USA by age. This shows that the employment differentials between the two groups is particularly large when employees are young and starting their careers, but shrinks quickly over the employees’ lifespans. This highlights the need to understand not only why employment differentials exist between groups at one point in time, but also how they evolve over the working lives of the individuals.
Figure 1 Employment rates by age and race: going beyond static differentials
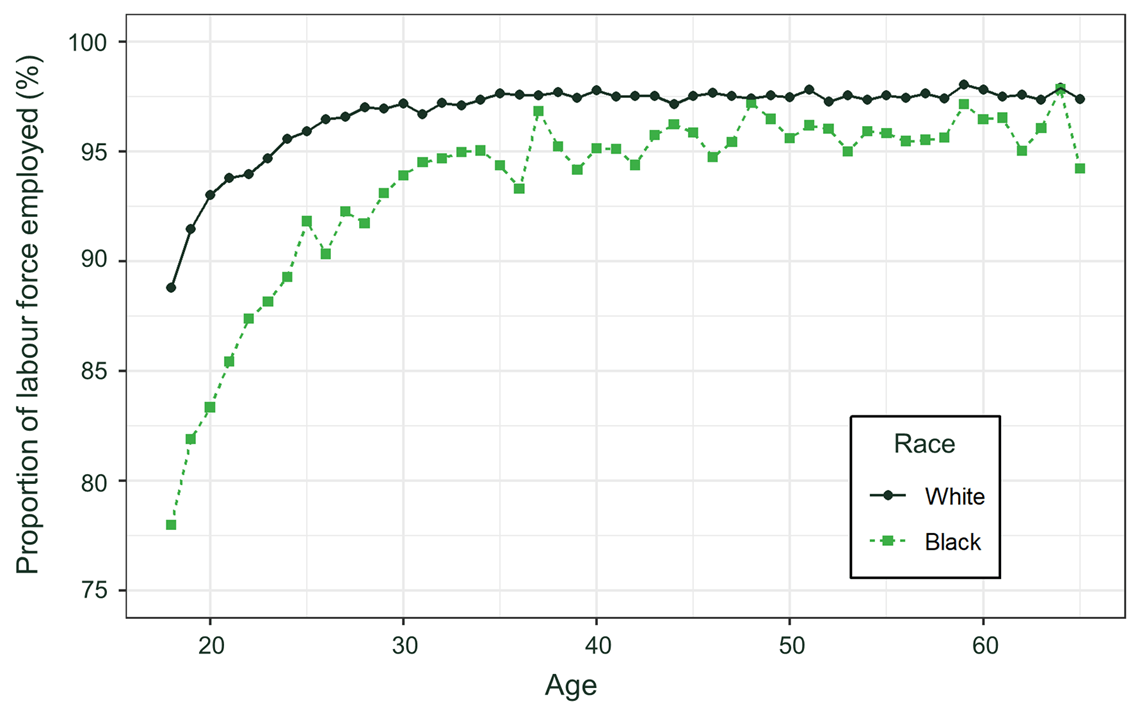
Source: Krkoska, E.
There are two main theories about why gaps in wages and employment exist between those of different groups. Models of taste discrimination[3] assume that some employers simply dislike hiring members of a certain group and face a ‘psychic cost’ of employing a member of that group. From this starting point, it follows intuitively that the resulting market outcome will be that members of a group that is discriminated against will suffer with lower wages and employment rates than others.4
Theories of statistical discrimination5 are much broader in scope and attempt to explain how differentials can emerge even when employers are not prejudiced against a particular group. A number of very creative models have been written that have done this successfully, and have provided a number of useful intuitions that have improved our understanding of the data. An example is the Coate–Loury Model,6 in which there are self-fulfilling negative stereotypes. Employers believe that one group is less qualified than the other and are thus less likely to hire members of this group for a good job. In turn, members of this group know that they are less likely to be hired for the good job and have less incentive to invest in their qualifications, thus confirming the employer’s beliefs to be true.
Another example of statistical discrimination occurs where group membership is used as a proxy for unobserved worker ability, since the two are related, but only the group membership is observable. Wage differentials thus emerge in a variety of scenarios, including where there are differences in the average level of ability between groups and also where there are group-specific differences in the precision of the signals that employers receive about the candidates abilities.7
The model set out below features elements of both taste-based and statistical discrimination, in which the interesting features result from the fact that job candidates are evaluated not only once, but repeatedly, meaning that employers in the future can use the decisions of employers today to improve their evaluation of job candidates’ unknown ability. Importantly, the main results arise from beliefs about discriminatory attitudes that might have been held by the previous employers of job applicants.
The model was developed by the author of this article during his graduate studies in Economics at the University of Oxford.8 The example below details a specific scenario in which initial discrimination may impact future outcomes in the labour market, and how the scale of this impact may depend on information and beliefs that firms hold regarding past discrimination.
An example: Amy and Annie
Consider two individuals, Amy and Annie. Amy belongs to the majority group, while Annie is a member of a group that suffers from discrimination.
Suppose that they both finish their undergraduate degree in the same year, and that their prior qualifications are identical. They both apply for graduate jobs and Amy is able to secure a year-long contract for a graduate scheme job. Annie is discriminated against by the firms to which she applied and instead spends a year unemployed.
One year after graduation, Amy and Annie both apply for jobs once again. Amy’s employment record sends a strong signal of ability to the firms to which she applies and she secures another employment contract. Suppose now that the firms to which Annie applies are non-discriminating. There are three possible scenarios for how she is evaluated.
- Full information. If it is known for sure that Annie was discriminated against last year, and that this was the reason she was unemployed, the potential employer will rationally disregard the unemployment spell as a signal of ability and instead evaluate her based on other available information.
- Partial information. In this intermediate case, the employers are aware of the presence of discrimination but cannot tell whether or not Annie has been discriminated against. They thus face extra uncertainty in evaluating Annie’s ability, since they cannot be sure whether the unemployment spell was a result of fair evaluation by previous employers, or discrimination.
- Naïve beliefs. If the employers are unaware of discrimination in the labour market, they (incorrectly) interpret the unemployment spell as a signal of low ability, since it is believed that the employers who previously evaluated and rejected her must have rationally come to the conclusion that she was of low ability. The employers thus, wrongly, take this to reflect poorly on Annie’s underlying ability.
Observational learning
In order to generate their outputs, firms require workers, but the ability levels of prospective workers vary and are not perfectly known by firms. Workers nevertheless can indicate their likely ability in various ways, such as through performance in job interviews or standardised tests. Further, the decisions of past employers to hire or reject a job candidate is observable, since when job candidates apply for a position, their application will cover their employment history—or their lack of it. This provides further information about a given candidate’s ability, since an unemployment spell indicates that other firms have evaluated the candidate lacking ability, while the opposite is true for those with strong employment records.
This mechanism through which employers use the decisions of other employers as a source of information is called ‘observational (or social) learning’. It means that decisions today are based both on information gathered by the current decision-maker and on what can be inferred from the choices of others.9,10
It was noted above that some firms discriminate (based on distaste) against members of a specific group and are unwilling to hire them, and that employers do not necessarily know if the previous employer that hired/rejected a job applicant held this distaste. One may think that it is rational for firms to base their hiring decisions, in part, based on candidates’ (un)employment histories since current employers learn about candidates’ ability through the choices of past firms to hire or reject them. But the process of observational learning will be complicated due to some workers being rejected not due to their likely ability level, but also as a result of discrimination.
The evolution of employment disparities under the mechanism of observational learning will crucially depend on the structure of information and beliefs.
Partial information
Under a structure of partial information, it is assumed that firms in the economy do not know for sure which other firms are discriminating against certain job applicants, but they know that these firms exist, as well as the probability that a firm operates in this way. Then, as job candidates initially join the labour force, they apply for jobs and send a signal to their potential employer that is related to their underlying ability. Because of firms that discriminate against one group of workers, some members of this group will suffer directly from unemployment.
The novel insights from the model occur in the next stage, where previously employed and unemployed job candidates apply for jobs once again. For members of a group that does not suffer from discrimination, past employment and unemployment provides an additional signal of their likely underlying ability. On the other hand, for those in a group that do suffer from discrimination, it is not clear to the future employers whether previous rejections, resulting in unemployment, will have been caused by a weak signal of underlying ability, or simply due to discriminatory attitudes.
Because employers are rational, they take into account that past unemployment might have been caused by discrimination, which results in a benefit-of-the-doubt effect, where those who would usually be rejected may actually gain employment because their previous unemployment spell is evaluated with extra lenience. This added lenience, which arises purely from rational profit-maximising behaviour, has the opposite effect of the initial discrimination and may overall be sufficiently strong to reverse the initial employment difference between the two groups, making members of the group that is discriminated against, on average, better off than the other group.
Naïve beliefs
An alternative setup to analyse this model is one where firms are naïve about the potential discriminatory attitudes of other employers. When considering job applicants, they do not take into account the fact that they might have been rejected due to discrimination This does not necessarily mean that employers are unaware that discrimination exists in general, but it does imply that they fail to explicitly take it into consideration during the employee evaluation process.
Initial discrimination towards members of a certain groups leads to job candidates being rejected from jobs for which they are qualified. Ignoring the fact that unemployment may have been caused by discrimination, those who suffered initially from discrimination are less likely to be hired even by employers who do not discriminate themselves, and thus the employment discrepancies between the groups becomes exacerbated. Initial discrimination results in a permanent disadvantage under this belief system.
Figure 2 shows graphically the differences between the dynamics that result from partial information (panel (a)) and naïve beliefs (panel(b)). The x-axis displays the probability that a candidate randomly matches with a discriminating employer and the y-axis presents the ratio of employment rates between members of a group that is not discriminated against to one that is discriminated against—this is called the ‘discrimination ratio’.
Figure 2 Visualisations of theoretical results
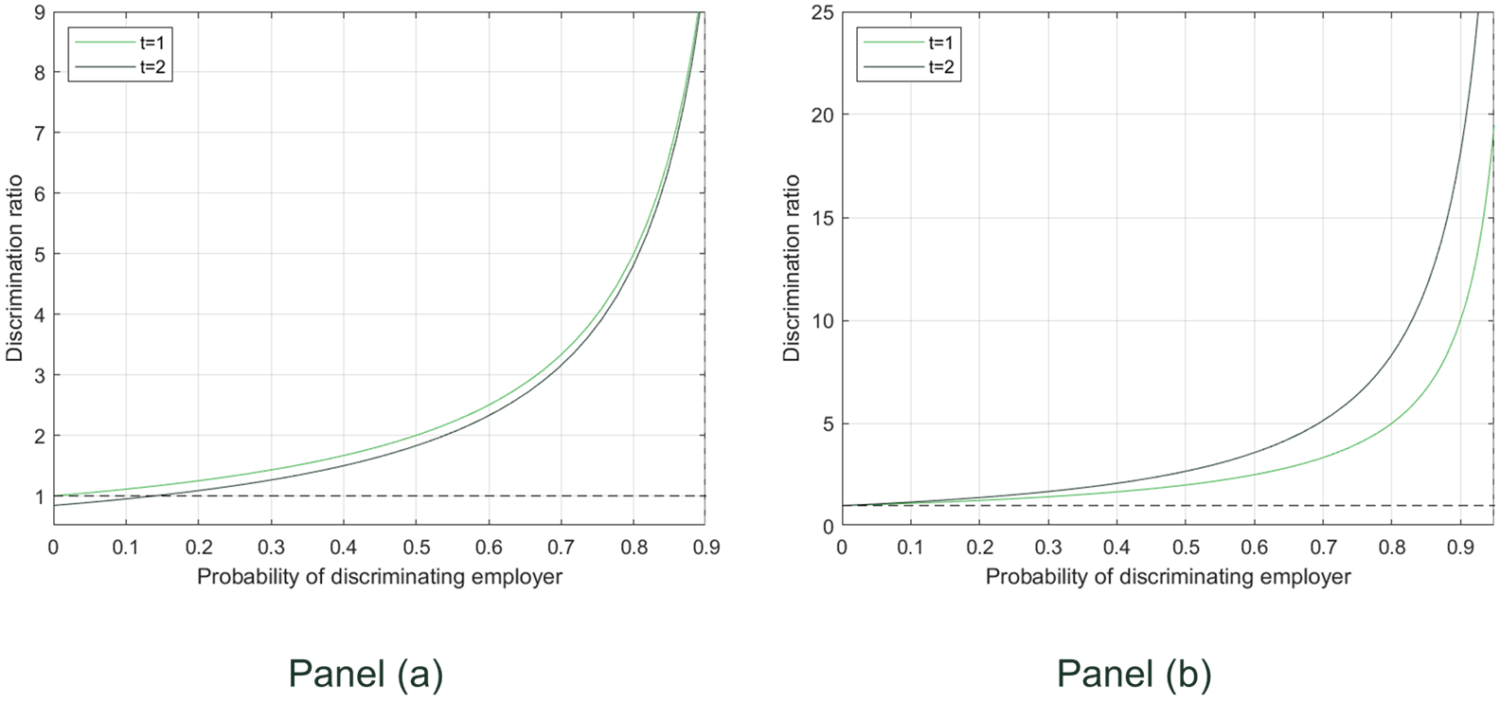
Source: Krkoska, E.
A ratio of 1 (displayed in Figure 2 as a dashed line) means that both groups are equally likely to find employment, whereas a ratio above 1 indicates that those in the discriminated-against group are less likely to find employment than those in the other group. The greater this ratio, the worse off those in the discriminated group are. Alongside the dashed line that serves as a reference point, there are two curves in each panel (labelled as t=1 and t=2), and each correspond to one of the periods in the two-period model. It can be seen that in the second period of the model the employment difference between the groups decreases under partial information but increases under naïve beliefs. The evolution of group differences over time thus depends on the beliefs of employers concerning the discriminatory attitudes of other employers.
Next steps
If firms are aware of the presence of discrimination, but are not sure exactly whether a spell of unemployment has been caused by discrimination or not, then they will be especially lenient in their evaluation, giving the benefit of the doubt to candidates who may have been previously discriminated against. This reduces the difference in employment rates between the groups, since some candidates who were previously rejected for legitimate reasons gain from this benefit-of-the-doubt effect. Conversely, if employers are naïve and fail to take into account that a certain group is discriminated against in the labour market, unemployment spells caused by discrimination are incorrectly perceived as a negative signal of underlying ability and result in a worsening of the employment difference between the groups.
It is clear from the data that there are still large and persistent gaps in wages and employment rates between groups to this day. A large body of literature has sought to understand the contributing factors to this phenomenon, as well as possible rectifications. The model discussed in this article sheds light on mechanisms that have not been previously studied and combines elements of both taste-based and statistical discrimination.
Future research will need to evaluate the actual beliefs of employers and how those beliefs operate in labour markets. Policymakers can then find ways to combat discriminatory outcomes.
1 Blau, F.D. and Kahn, L.M. (2017), ‘The gender wage gap: Extent, trends, and explanations’, Journal of Economic Literature, 55:3, pp. 789–865.
2 Oaxaca, R. (1973), ‘Male-Female Wage Differentials in Urban Labor Markets’, International Economic Review, 14:3, pp. 693–709; Blinder, A.S. (1973), ‘Wage Discrimination: Reduced Form and Structural Estimates’, Journal of Human Resources, 8:4, pp. 436–55.
3 Becker, G.S, ‘The Economics of Discrimination’, University of Chicago Press Economics Books.
4 It is interesting to note that if the firms are operating in a competitive final goods market then firms acting with discriminatory attitudes and underpaying some of their employees would give other firms an incentive to enter the market and hire their workers, paying them the competitive wage equalling their marginal product. It would thus be impossible for different groups to receive different wages. For further discussion, see Hirata, G. and Soares, R.R. (2016), Competition and the Racial Wage Gap: Testing Becker’s Model of Employer Discrimination.
5 Fang, H. and Moro, A. (2011), ‘Theories of statistical discrimination and affirmative action: A survey’, Handbook of social economics, 1, pp. 133–200.
6 Coate, S. and Loury, G.C. (1993), ‘Will affirmative-action policies eliminate negative stereotypes?’, The American Economic Review, 83:5, pp, 1220–40.
7 Phelps, E.S. (1972), ‘The statistical theory of racism and sexism’, The American Economic Review, 62:4, pp. 659–61; Aigner, D.J. and Cain, G.G. (1977), ‘Statistical theories of discrimination in labor markets’, Ilr Review, 30:2, pp. 175–87.
8 To ensure the accuracy of the model and its accompanying theoretical results, it has been reviewed by several members of the Economics Department at the University of Oxford.
9 It’s worth noting that observational learning is not only found in the context of employment. An everyday example of observational learning is using the number of individuals eating at a restaurant as an indication of its quality. The observable choices of others can be used to infer underlying information about the restaurant’s quality.
10 A technical point to note is that in observational learning models, agents do not make their decisions in order to purposefully influence the choices of future decision makers, as they do in signalling models such as Spence, M. (1973), ‘Job Market Signaling’, The Quarterly Journal of Economics, 87:3, pp. 355–74.
Contact

Leon Fields
Senior ConsultantGuest authors
Eduard Krkoska
DPhil Candidate, University of Oxford
Related
Related

No water, no growth: tackling inefficient business water demand
Water is not typically thought of as a constraint on economic growth in England. Yet that is precisely what it is becoming. Commercial growth and new developments are being turned away because there is insufficient water to serve them. Some water companies are already exercising their powers to refuse… Read More

The energy trilemma in focus: the price of dependence
Europe’s approach to energy policy has been in transition since the 2022 energy crisis laid bare the continent’s dependence on imported fossil fuels. More recently, the outbreak of war in the Middle East and the subsequent disruption to global oil and gas markets have caused further challenges. This article… Read More