
COVID-19, the Olympics and Belarus: using new data to understand the aviation sector
While the aviation sector is still in the early stages of its recovery from the COVID-19 pandemic, there are signs that it is also rapidly changing. Airlines are experimenting with their networks, and it is predicted that there will be consolidation.1 Some airlines that have made substantial cuts to their crew and fleet now face the challenge of ramping back up to meet demand. There have also been events such as the Tokyo Olympics and the ban on flights in Belarusian airspace that have had significant effects on specific route markets. This article examines aviation data that Oxera has collected to better understand how fares and frequencies are evolving as a result of the pandemic and these recent events.
It has been a difficult 18 months for the aviation sector. Data from the European Organisation for the Safety of Air Navigation (‘EUROCONTROL’) shows that in April 2020, total flight volumes (measured in air traffic movements, ATMs) were around 90% below 2019 levels. Flight volumes have since recovered significantly, to around 28% below 2019 levels. Figure 1 illustrates the fluctuation in these flight volumes over time.
Figure 1 Daily ATMs in EUROCONTROL’s total network area relative to 2019 levels on the same day
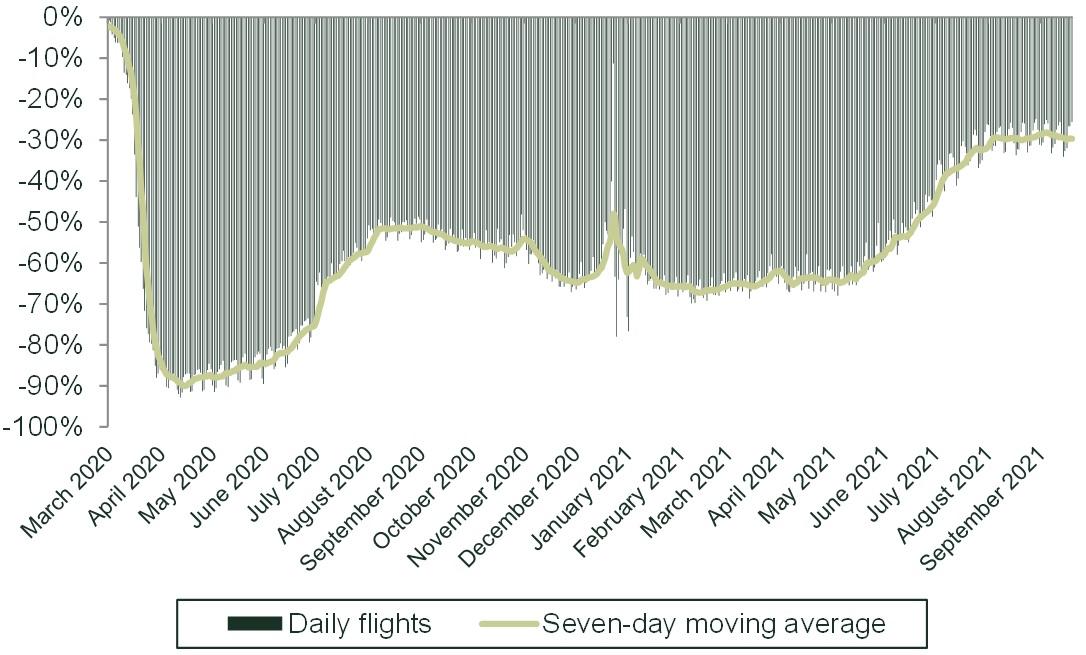
Source: Oxera analysis of EUROCONTROL data.
The speed of recovery has, however, been uneven across countries. For example, as at 8 September 2021, flight volumes in the UK were 44% below 2019 levels, lagging behind other countries, while the corresponding deficit in Greece was just 6%. Furthermore, passenger numbers remain low relative to flight volumes, suggesting that demand is not returning as quickly as supply, and that load factors remain low relative to pre-pandemic levels. As at 17 September, passenger traffic was 45% below 2019 levels in EU/EEA/Switzerland and 67% lower in the UK.2
There is much that deserves consideration when assessing the prospects for recovery in the aviation sector.
- On the demand side, uncertainty about travel restrictions and the need for passengers to take (sometimes costly) COVID-19 tests may mean that demand could remain low even after travel restrictions are lifted.
- On the supply side, some carriers had to implement deep cost-cutting measures, including downsizing their staff and fleet during the pandemic. This may affect how, and the extent to which, airlines are able to respond to the return of demand.
In addition to the pandemic, a number of other events have had a significant impact on specific route markets over the last year. For example, the Olympics led to a sharp rise in demand for flights to Tokyo, despite a ban on international spectators.3 Another example is the diversion of Ryanair Flight 4978 to Belarus, which led to the EU and the European Aviation Safety Agency (EASA) issuing Directives banning airlines from flying over Belarusian airspace.4 Analysis of these routes provides an indication of how airlines are responding to changing market conditions.
A unique dataset of fares, frequencies and quality measures to understand outcomes in the aviation market
Oxera has collected a flight-level dataset of routes departing from or arriving in Europe, with data points on fares and frequencies for each airline on a given route over time. This third-party dataset also includes estimates of carbon emissions and a number of variables measuring quality, such as legroom and onboard Wi-Fi access. Through this dataset, we are able to capture airline yield management strategies and the prices facing different passenger segments—for example, we collect data on prices at several different points ahead of a given flight’s departure date.
The dataset helps us to answer a number of questions on selected routes in relation to the pandemic, the Tokyo Olympics and the EU Directives to avoid Belarusian airspace. In particular, we consider the following.
- How have market outcomes, such as fares and frequencies, responded?
- What is the impact of entry and exit on fares and frequencies?
- Have airlines been able to expand capacity to meet demand?
Route case studies: four different stories
We first examine market outcomes on two routes, London–New York and London–Faro, to understand more about the recovery of the sector from the pandemic. These routes have been chosen as they are important aviation markets where there have been changes in travel restrictions. The impact of the Tokyo Olympics is then investigated by looking at the London–Tokyo route, and the Belarus flight diversion by examining the Moscow–Minsk and Minsk–Paris routes.
London–New York: airlines entered and expanded frequencies in August, but have yet to respond to the relaxing of US travel restrictions
London–New York was the eighth-busiest international route in the world in 2019 in terms of total available seats.5 For some airlines, the route is commercially significant: British Airways earned more than $1.15bn on the Heathrow–JFK route in 2019, the only route in the world where an airline has crossed the $1bn mark in terms of annual revenues.6
Rising fares over June and July were followed by entry and an expansion of frequencies, suggesting that airlines have been able to respond to demand.
Figure 2 belowshows fares on the London–New York route for flights booked 14 days in advance for the period from 6 April 2021 to 1 September 2021 (e.g. a data point on 1 July 2021 is the average daily fare for flights 60 days ahead of that day).7 While prices rose over the course of July, there were no significant changes in frequencies over this period, suggesting that there was rising demand but airlines had not yet increased capacity.
On 28 July, the UK government announced that vaccinated passengers did not need to self-isolate on arrival in the UK.8 This led to significantly greater fare volatility. Nonetheless, on average, the increase in flight frequencies, particularly for British Airways, and the entry of JetBlue (see Figure 3) appear to have largely absorbed the increase in demand, such that prices, though volatile, have remained similar to the past.
Figure 2 London–New York fares: 14-day-ahead average daily fares
Note: All data points prior to May 27 are for fares purchased 28 days ahead, while all data points after that date are for fares bought 14 days ahead due to a change in the way in which the data was collected. This is the case for the rest of the figures presented in this article. Gaps between data points are due to data being unavailable on those days or flights being unavailable for the airline on that day. The other airlines operating on the route are Delta and Virgin Atlantic. For the purposes of readability, we do not represent data for these two airlines.
This figure and those below are interactive. You can hide or display the data for a particular airline by clicking on the airline’s name in the legend. To focus on a particular period in the chart, draw a box over the time period of interest (by left-clicking, holding and dragging).
Source: Oxera analysis based on Google Flights data points.
Figure 3 London–New York: 14-day-ahead daily frequencies
Note: The entry of Jet Blue can be observed in early August, when the airline started offering daily frequencies.
Source: Oxera analysis based on Google Flights data points.
The easing of travel restrictions by the USA, announced on 20 September, has not yet led to an increase in frequencies.
Entry into the USA is currently restricted: for example, at the time of writing (26 October) it is not possible for most British nationals to enter the USA if they have been in the UK (or a number of other countries) within the previous 14 days. Only US citizens (and a few groups of other travellers) are able to enter the USA, subject to testing requirements and self-quarantine rules for those who are unvaccinated.9 On 20 September 2021, the US government announced that it would enable vaccinated travellers from certain other countries with a negative COVID-19 test result prior to travel to enter the USA from early November.10
In order to capture the impact this may have on demand, we consider fares for flights booked 60 days in advance (rather than 14 days in advance) so that the flight departure date falls in November— see Figure 4 below.
Prior to 20 September 2021, fares were relatively stable on this route over the period. However, from 20 September, there was significantly greater fare volatility and higher average fares. For example, in the month of September prior to the US announcement, British Airways’ fares ranged between £300 and £400, but on 20 September, this increased significantly to around £600.
Figure 4 London–New York fares: 60-day-ahead average daily fares
Note: The other airlines operating on the route are Delta and Virgin Atlantic. For the purposes of readability, we do not show these airlines.
Source: Oxera analysis based on Google Flights data points.
Despite the easing of travel restrictions from 20 September, there is not, as yet, evidence that this has led to an increase in frequencies (see Figure 5). This may be due to airlines waiting for further certainty before increasing capacity. For example, it was announced only on 15 October that the travel restrictions would be lifted on November 8.11
Figure 5 London–New York fares: 60-day-ahead daily frequencies
Source: Oxera analysis based on Google Flights data points.
London–Faro: easyJet experiments while Ryanair maintains steady frequencies
Figure 6 and Figure 7 show the daily fares and frequencies based on bookings 14 days in advance for easyJet on the London–Faro route. easyJet significantly increased its fares at the end of April (see Figure 6), which coincided with media speculation that Portugal could soon be added to the green list and a rise in demand.12 When the decision to include Portugal in the green list was announced on 7 May 2021, easyJet increased its frequencies.
However, when it was announced that Portugal would be moved to the amber list in early June, easyJet reduced its frequencies. This coincided with a sharp increase in fares, indicating that demand remained high despite the move to the amber list. easyJet subsequently increased its frequencies in the early part of July, which coincided with a reduction in its fares.
Figure 6 London–Faro fares: 14-day-ahead average daily fares for easyJet
Note: The grey region here covers the period in which the travel corridor list had not yet been introduced; the green region covers the period when Portugal was on the green list (no requirement to self-isolate on arrival in the UK); and the amber region covers the period when Portugal was on the amber list (with passengers being required to self-isolate).
Source: Oxera analysis based on Google Flights data points.
Figure 7 London–Faro: 14-day-ahead frequencies for easyJet
Source: Oxera analysis based on Google Flights data points.
In contrast to easyJet, when Portugal was put on the amber list, Jet2 (which had recently entered the route) and Ryanair’s frequencies remained relatively stable on the London–Faro route. The high capacity in the market led to low fares.
Overall, the initial evidence presented suggests that airlines on this route are able to adjust their supply rapidly in response to changes in demand. However, in early October, there was a significant increase in fares, coinciding with the UK’s decision to simplify its travel rules.13 An important question will be whether airlines can continue to respond to changes in demand as demand recovers more broadly across a wider number of route markets.
London–Tokyo: frequencies have not responded to the rise in demand due to the Tokyo Olympics
In June 2021, ahead of the Olympics in July, All Nippon Airways (ANA) significantly increased its fares (see Figure 8); and from around early July to early August, which overlapped with the Tokyo Olympics, there was a high degree of fare volatility across all airlines, with a significant increase in average fares. This rise suggests that demand for flights to Tokyo increased, even though international spectators were not allowed to enter Japan.14 At the same time frequencies remained stable throughout the period (see Figure 9).
This leads to questions around might be driving the lack of a supply response. For example, these trends could also be in line with market fundamentals if, for example, it is difficult to increase frequencies on a given route for just a short period of time. They may also be due to the uncertainty as a result of the pandemic, which has made it harder for airlines to predict and manage demand.
Figure 8 London–Tokyo fares: 14-day-ahead average daily fares
Source: Oxera analysis based on Google Flights data points.
Figure 9 London–Tokyo: 14-day-ahead daily frequencies
Source: Oxera analysis based on Google Flights data points.
Paris–Minsk and Minsk–Moscow: indirect connectivity preserved, likely via Moscow and Minsk, when direct connectivity is broken
On 25 May, Ryanair Flight FR4978, en route from Athens to Vilnius, was diverted by the Belarusian government to Minsk. As a consequence, the EU and the EASA issued Directives that stopped European airlines from flying in Belarusian airspace. This led to a loss in connectivity on particular routes. For example, on the Paris–Minsk route, prior to the event, Belavia was charging around £200–£300 for a return flight when tickets were booked 14 days ahead of the departure date. However, after the event, airline services were no longer offered on the route.
In response, airlines started operating between Minsk and Moscow after the EASA Directives were introduced (see Figure 10). This might suggest that airlines were preserving connectivity to Minsk by connecting flights via Moscow.
This might also suggest that airline markets are quite flexible in preserving indirect connectivity to particular destinations if direct connectivity is broken. However, a return flight between Minsk and Moscow costs between £100 and £300, meaning that the cost of travel would be likely to be significantly higher for any connecting passengers hoping to travel to Minsk via Moscow (see Figure 11).
Figure 10 Minsk to Moscow fares: 14-day-ahead daily frequencies
Source: Oxera analysis based on Google Flights data points.
Figure 11 Minsk to Moscow fares: 14-day-ahead average daily fares
Source: Oxera analysis based on Google Flights data points.
Keeping an eye on market outcomes
The pandemic has been hugely disruptive to the aviation sector. While demand is now starting to return, an important question is whether airlines are able to respond on the supply side. There is some evidence that they have been able to respond to changes in travel restrictions, by increasing capacity or by entering a route, and thus leading to rises in demand. This might have limited increases in fares, such as on the London–New York and London–Faro routes. In other cases, there has been flexibility in airline networks—for instance, where direct connectivity has been lost between two places (e.g. between Paris and Minsk), airlines have adapted their networks to preserve indirect connectivity (e.g. through a rise in frequencies for the Moscow–Minsk route). However, on the London–Tokyo route, there has been limited capacity with rising fares.
Moving forward, it may also be more likely that airlines will find it difficult to further increase capacity and to do so quickly in response to changing circumstances—for example, due to a lack of crew and/or aircraft. This is shown through rising fares in response to the recent easing of travel restrictions in the UK and the USA. It may therefore be a long and volatile road back to normality for the aviation sector.
1 For example, see Financial Times (2021), ‘O’Leary says Wizz Air and easyJet must merge or be taken over’, 11 September.
2 Airports Council International (2021), ‘COVID-19 update. Passenger traffic impact’, 17 September.
3 CNBC (2021), ‘International spectators to be barred from entering Japan for Olympics’, 20 March.
4 European Aviation Safety Agency (2021), ‘EASA issues Safety Directive calling on Member States to mandate avoidance of Belarus airspace’, 2 June.
5 OAG (2020), ‘Busiest routes 2020’, April, p. 4.
6 Aviationbusinesme.com (2019), ‘London Heathrow to New York JFK: the only billion-dollar route in the world’, August.
7 These data points also assume that a traveller is returning on a flight seven days later.
8 The UK government announced that fully vaccinated travellers would not need to quarantine on arrival or take a day 8 test, but would still need to complete a pre-departure test alongside a PCR test on or before day 2 after arrival. See Department for Transport (2021), ‘UK travel update; government waives quarantine for arrivals fully vaccinated from Europe and USA while also confirming international cruise restart’, 28 July.
9 UK government (2021), ‘Foreign travel advice: USA’, as at time of writing on 26 October 2021.
10 International Air Transport Association (2021), ‘Statement on the US decision to lift COVID-19 travel restrictions from certain countries’, 20 September.
11 Shabad, R. (2021), ‘U.S. to ease Covid travel entry rules, require vaccinations for foreign visitors on Nov. 8’, NBC News, 15 October.
12 Plush, H. (2021), ‘Portugal could soon be added to holiday green list’, The Telegraph, 27 April.
13 Morton, B. and Turner, L. (2021), ‘Covid: amber list scrapped as travel rules simplified’, BBC News, 4 October.
14 CNBC (2021), ‘International spectators to be barred from entering Japan for Olympics’, 20 March.
Related

No water, no growth: tackling inefficient business water demand
Water is not typically thought of as a constraint on economic growth in England. Yet that is precisely what it is becoming. Commercial growth and new developments are being turned away because there is insufficient water to serve them. Some water companies are already exercising their powers to refuse… Read More

The energy trilemma in focus: the price of dependence
Europe’s approach to energy policy has been in transition since the 2022 energy crisis laid bare the continent’s dependence on imported fossil fuels. More recently, the outbreak of war in the Middle East and the subsequent disruption to global oil and gas markets have caused further challenges. This article… Read More