
Catchment if you can: a practical guide to local competition analysis
Many markets involve local or regional competition between firms. Retailers, hospitals, airports, and even funeral directors compete for their customers locally. Empirical techniques for analysing competition in local markets have developed and become more sophisticated over time. But which techniques provide the most accurate assessment? We discuss and compare a range of practical methods that have been used in recent competition cases.
How far do you travel to do your groceries, and how important is distance in your decision about where to shop? For most people in cities, the answer to the first question might be anywhere between 5 and 15 minutes of walking or cycling time. For people in more rural areas, the answer could be anywhere between 5 and 15 minutes of driving time. For others the travel time can be considerably more, and in extreme cases consumers may consider travelling for hours if they can buy groceries for a much lower price across a national border.1
In many competition cases, in order to understand the local competitive dynamics it is important to consider consumers’ behaviour when travelling to shops, hospitals, airports, car dealerships or other destinations.2 One method to identify competition on a local scale—catchment area analysis—has been established in multiple mergers, abuse of dominance cases and market investigations across several jurisdictions. Here, the catchment area is typically defined in terms of the time or distance that most customers are willing to travel, and represents the area from which the provider is expected to draw the vast majority of its business. Using catchment areas may allow competition authorities to assess questions such as whether a local entity holds a dominant position, or how a merger affects competition in each local market.
The techniques for assessing local competition have evolved and become more sophisticated over time. In this article we first discuss catchment area analysis and the ‘weighted share of shops’ approach—two tools that are often used to determine competition in local markets. We then discuss some more sophisticated techniques that focus on demand-centred analyses, taking into account the distribution of customers within a catchment area. These techniques can be applied in all types of competition case.
Types of local competition analysis
Catchment area analyses
Catchment areas are particularly useful in providing an insight into the willingness of consumers to travel to purchase products or services, or the willingness of companies to travel to customers,3 and can therefore be used to gain an understanding of the geographic size of a market and the degree of competition within it.
A simple catchment area can be drawn by plotting all the customers of a shop (or other local entity) by their drive time or distance travelled to the store, and then determining the percentage of those customers that make up the vast majority of the store’s business. For example, the catchment area ‘isochrone’4 could be set as the distance of the furthest customer, such that the catchment area captures all of the entity’s customers.
A key consideration when determining a catchment area concerns which consumers to include. For example, when assessing a hospital merger, the consumers are the patients,5 and the data is likely to contain a few patients who are located very far away. This can be for several reasons: artefacts in the data, such as a patient moving to a new city but continuing to use their previous hospital, or a student being registered at their university town but going to a hospital near their home town; or quality reasons, such as a hospital having a niche specialism or a great surgeon who attracts consumers from far and wide. Should the outliers, such as the student visiting a hospital in their home town, count as part of the catchment area? Probably not. Should the hospital with a brilliant surgeon who causes patients to travel further have a wider catchment area than others? Probably yes. The size of the catchment area depends on the frequency of such occurrences.
To remove outliers in the customer location data, catchment areas generally cover less than 100% of all patients or consumers. Indeed, a catchment area that captures the closest 80% is often used (although the exact choice of percentile will be case-specific).6
While catchment areas can be informative when considering consumers’ preferences in terms of distance or travel time, one should not overly rely on catchment areas when assessing the competitive dynamics in a market. Often catchment areas provide a first basis to estimate the market shares of a given party or parties (in the case of a merger) by looking at all entities that are located within that catchment area. This, however, may not always provide a balanced view of the actual competitive dynamics in a market.
For example, for supermarkets, distance may be the most important factor for a consumer when deciding where to do their shopping. If a large supermarket is located at the edge of a catchment area, while two smaller supermarkets are located next to each other within that same catchment area, market shares that are calculated based on the entire catchment area (e.g. in terms of revenue) are likely to overstate the competitive constraint of the large supermarket on the smaller ones. This is because, although the larger supermarket has the wider catchment area, a particular smaller store may attract less mobile customers from a narrower catchment area who do not enjoy the same choice as customers of the larger store.
This drawback of using catchment areas to estimate market shares has been acknowledged by competition authorities. For example, in its recent decision regarding the merger between Circle hospitals and BMI hospitals, the UK Competition and Markets Authority (CMA) considered market shares based on catchment areas to be a weak indicator of competitive constraints.7
Some more sophisticated tools based on catchment areas can provide further insight into local competition.
Weighted share of shops
A drawback of using simple isochrone- or iso-distance-based catchment area information8 to estimate market shares is that catchment areas alone do not take heterogeneity (such as distance or quality differences between shops) within a catchment area into account.
An established method to control for the distance between shops within a catchment area is to allocate weights to the shops based on distance or drive time.9 Shops that are located close to the focal shop are given a higher weight, while shops at the border of the catchment area are given a lower weight. Calculating market shares based on these weights may provide a more realistic picture of the competitive dynamics and the competitive pressure on the focal shop(s).
Weighting can also be used to control for differences between stores. For market shares to be informative, it can be useful to differentiate between (for example) discounters and more expensive shops. In this case, a higher weighting can be given to stores that are known to be similar to the focal store in terms of their offering/market positioning, whereas a lower weighing can be given to stores that have a clearly differentiated offering. Notably, in the 2019 Sainsbury’s/Asda supermarkets merger, the CMA assigned weights to the competitor stores based not only on proximity but also on brand of the store and store size.10
While weighting does allow for a better understanding of the competitive dynamics in a geographic market than catchment areas alone, the analysis still has the inherent limitation of not accounting for the distribution of customers within the catchment area. For example, two stores may not be located close to each other, but if they are both within easy reach of the same group of customers, they may act as important competitive constraints on each other.
Postcode analysis
Suppose there are two hospitals (A and B) located in Berlin, and the owner of hospital A is planning to acquire hospital B. To assess the effects of the merger, the catchment areas of the two hospitals can be estimated. A standard isochrone- or iso-distance-based catchment area implicitly assumes an even distribution of customers within that area. This may be broadly correct in some cases, as illustrated in Figure 1.
Figure 1 Hypothetical scenario 1: Berlin, patients
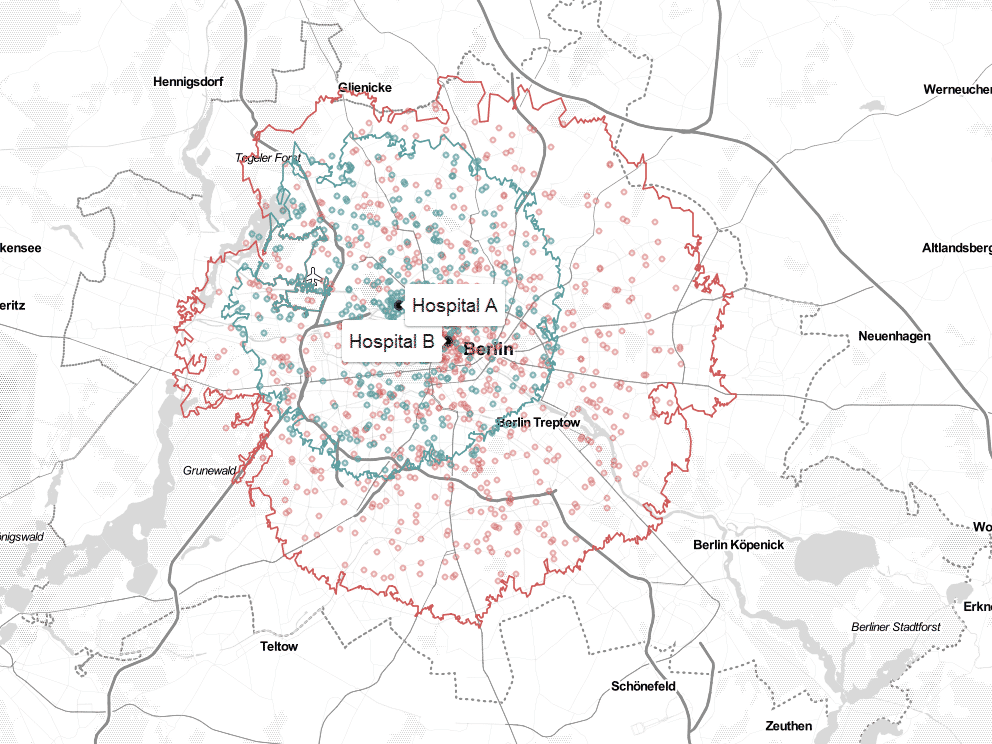
Figure 1 shows stylised locations of patients as individual dots within the catchment areas of hospital A (shown in green) and hospital B (shown in red). The implicit assumption of the two catchment areas is that competition for patients takes place within hospital A’s catchment area, as all of hospital A’s catchment area overlaps hospital B’s catchment area. The patients located outside hospital’s A’s catchment area, but within hospital B’s, are not considered to be affected by the merger.
While this would suggest an asymmetric competitive constraint, it also suggests that the two hospitals are in close competition for the patients located in the catchment area of hospital A. The figure shows that the hospitals indeed seem to be competing, as patients of both hospitals are located in the overlapping area. Patients in the overlapping area are therefore affected by the merger, as there will be one fewer competitor. The extent of the effect depends, among other things, on the number of third-party hospitals in the area, which would continue to provide a competitive constraint on the merged firm.
Now take a second example of two hospitals in London that have overlapping catchment areas but where a river separates the two (as shown in Figure 2).
Figure 2 Hypothetical scenario 2: London, patients
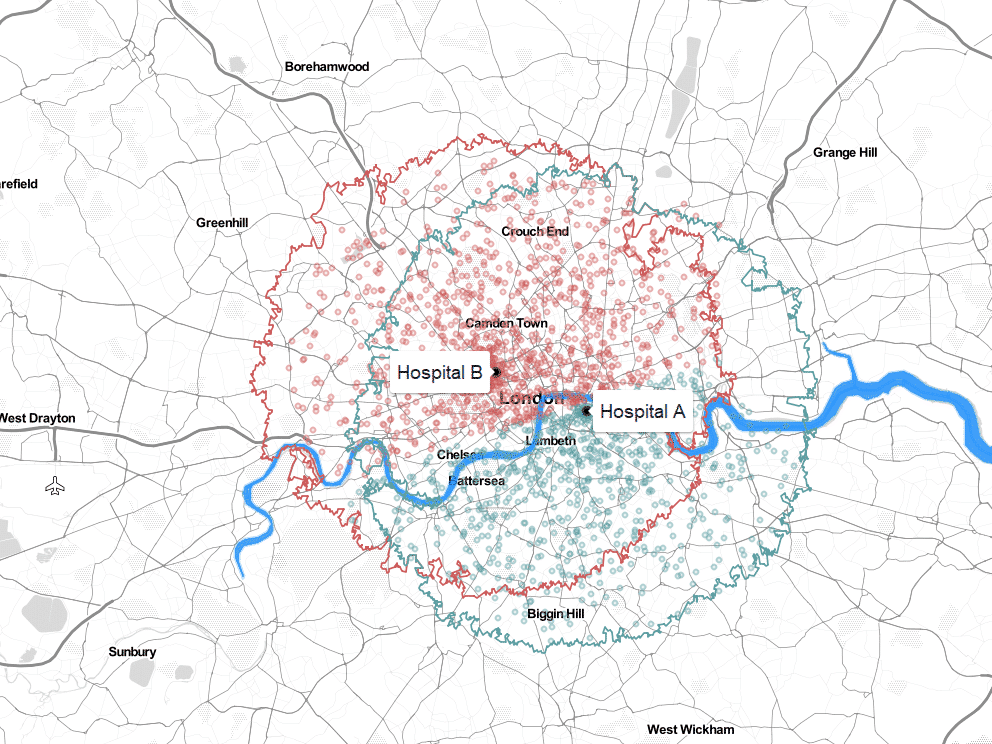
In this example, we can observe a relatively clear split of customers (shown as individual dots on the map), seemingly divided by the river Thames. This makes intuitive sense, especially if there are limited river crossing points; customers living north of the river may be more inclined to use hospital B as opposed to hospital A, and vice versa.
In this latter case, while the overlapping isochrones would suggest that the hospitals compete and therefore the merger would result in a less competitive market, the customer distribution shows that, in fact, each hospital finds itself in a different geographic market and the merger may therefore not lead to any real lessening of competition.
When assessing the effects of a merger, or in fact competitive constraints in any type of competition case, it is therefore important to not only estimate the catchment area, but also to look at the actual location of consumers. As shown in Figures 3 and 4 below, a slightly different version of the above analysis might look at the number of patients per postcode, and use that information to map from which postcodes hospitals attract patients.
Figure 3 Hypothetical scenario 2: London, districts hospital A
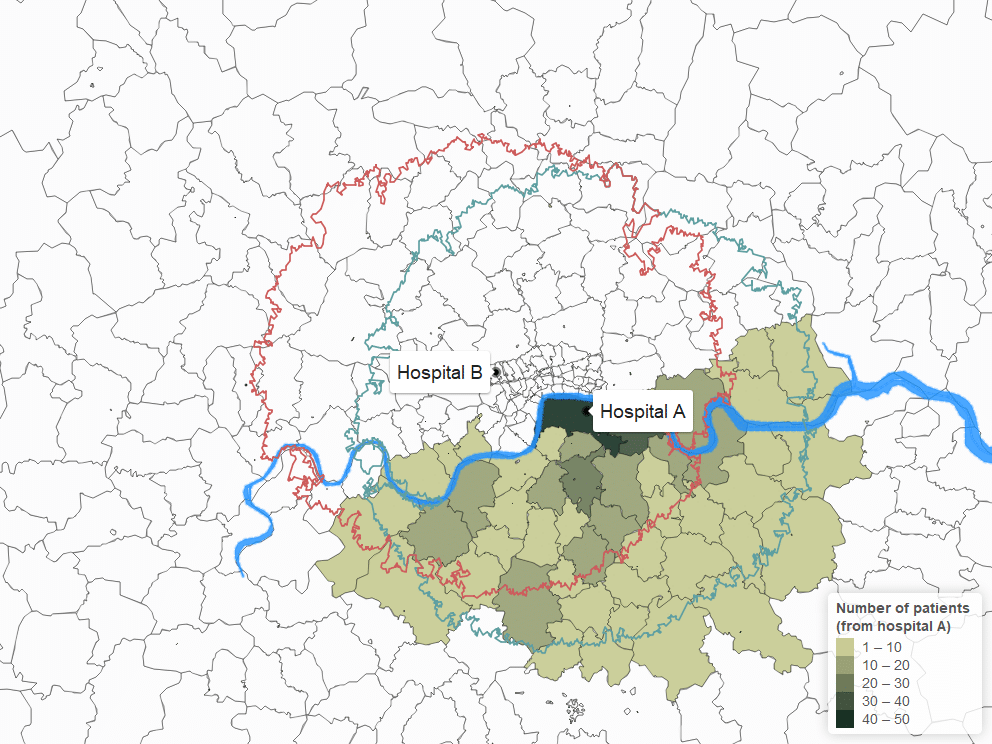
Figure 4 Hypothetical scenario 2: London, districts hospital B
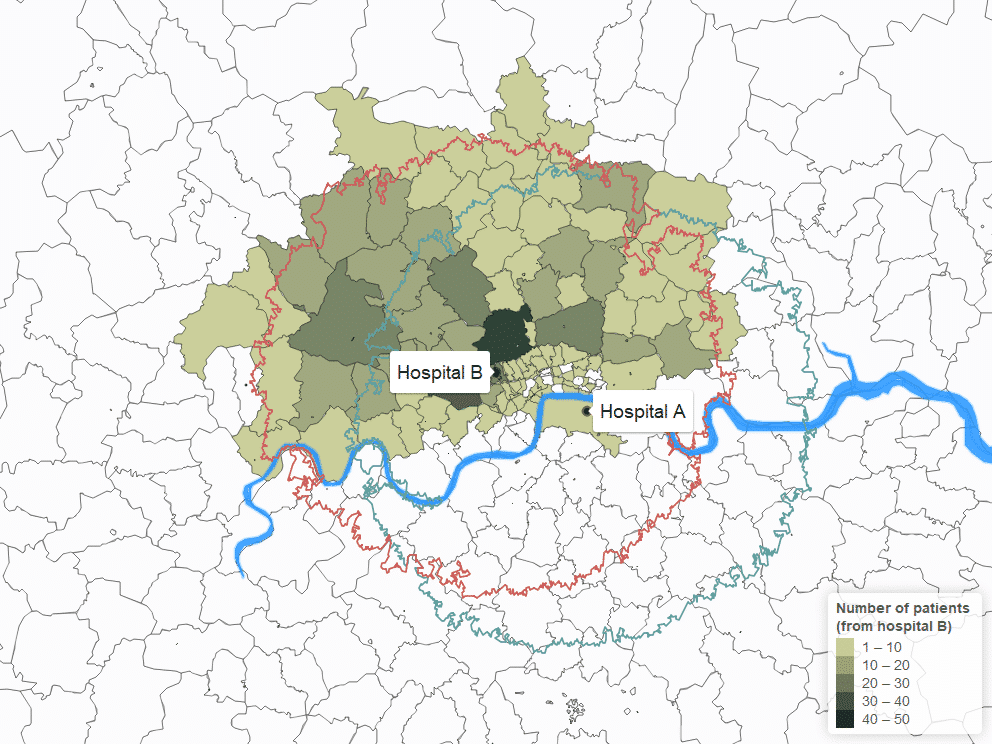
In its recent decision regarding the merger between Circle Health and BMI Healthcare, the CMA relied on such postcode analysis to assess the effects of the merger in places where the parties both had hospitals. It found that in one area the merging parties were not each other’s main competitors due to the distribution of their patients, despite one being located within the other’s (isochrone-based) catchment area.11
Merger effects analysis
The techniques described above are all centred around the merging parties’ locations. However, when considering whether a merger would significantly reduce competition, it is important to consider the options available from a consumer’s perspective.
A first metric to look at is the proportion of patients of each hospital that are affected by the merger—i.e. the percentage of patients of each hospital that come from the overlap between the merging parties’ catchment areas. In the example of Berlin above, it seems that 100% of the patients of hospital A are located in the catchment area of hospital B and may therefore be affected by the merger, while approximately 60% of the patients of hospital B may be affected as they are located in the catchment of hospital A.
This is informative, but it does not provide much detail on the actual effect of the merger—i.e. in terms of how much competition is left after the merger. This is especially the case in scenarios where there are many providers with partly overlapping catchment areas, and it may not be obvious how to assess the effects.
If sufficient data is available, one solution is to look at each individual consumer. For example, in the case of a hospital merger, using data on the catchment area of each hospital (including estimates for third parties) and the location of the patients of the merging hospitals, one can determine the number of hospitals that each patient is generally willing to travel to, and the impact of the merger on the number of competing options that they have to choose between.
Figure 5 below provides a simplified version of this analysis for three hypothetical patients. Hospitals A and B are merging, and hospitals C and D are third-party hospitals. Patient 3 is located within the catchment area of all the hospitals. This patient would face a 4-to-3 reduction in the number of hospitals that they can choose from. Similarly, Patient 2 would face a 3-to-2 reduction in the number of hospitals that they can choose from. Patient 1 is within the catchment area of hospital A but not hospital B. The merger would therefore not reduce competition for this patient.
Figure 5 Stylised example of merger effect analysis
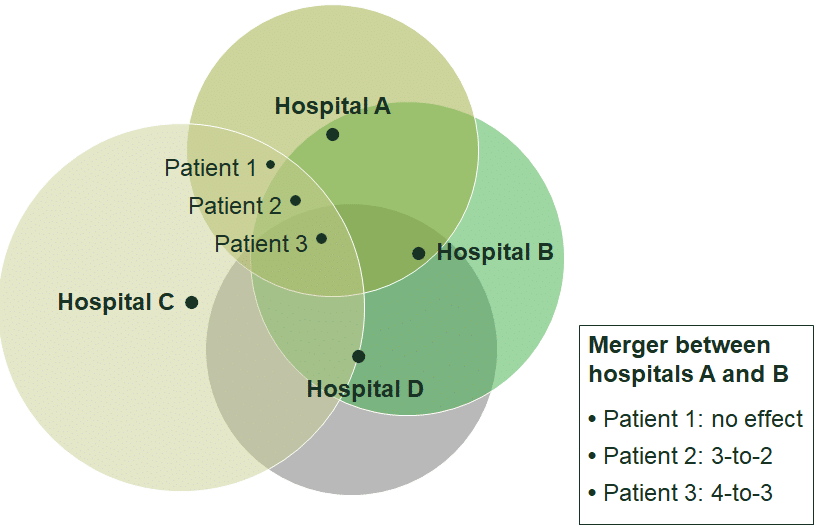
Using this information, one can determine for each of the merging parties the percentage of patients whose choice of hospitals that are under separate ownership would be unaffected by the merger, the percentage of patients that would face a 4-to-3 merger, the percentage that would face a 3-to-2 merger, and so on.12 This provides an important insight into the magnitude of any merger effect.
Mapping the right way forward
Ultimately, using a combination of the tools discussed above is likely to be appropriate for assessing competition in a local market. If any one tool is used in isolation, the analysis may overlook some important facts of the case.
Which types of analysis can be undertaken depends on the availability of data. In some markets, such as hospitals, detailed information on the locations of consumers (patients) is available, which allows for a thorough review of market dynamics. When assessing a retail market, on the other hand, a customer loyalty programme from a supermarket may provide useful location and other data.
In the absence of existing data on the location of customers, authorities and parties can make use of other data sources. For example, this could include surveys at the local supermarket to assess how far a representative customer travels and/or how likely they would be to travel to a different, potentially more distant, supermarket if their regular supermarket were to raise prices or reduce the quality of its offering.13
1 One example is the journey from Helsinki (in Finland) to Tallinn in (Estonia) on a two- or three-hour ferry to purchase alcohol. See, for example, The Economist (2029), ‘A populist party in Estonia pushes for cheaper booze’, 26 September; Yle (2014), ‘Booze cruise importers face limits’, 10 April; BBC News (2017), ‘Estonian tax threat to Finns’ booze cruises’ 7 June.
2 For example, Competition and Markets Authority, Celesio/Sainsbury’s (2016), Ladbrokes/Coral (2016), Tesco/Booker. Autoriteit Consument en Markt (ACM), Jumbo/Emte (2018). Belgische Mededingings Autoriteit, Ahold/Delhaize (2016). Competition and Markets Authority (2020), Circle Health/BMI Healthcare. The significant market power guidelines for aviation produced in 2017 by CMS and Oxera discuss how local competition around airports can be determined—CMS and Oxera (2017), ‘Market power assessments in the European airports sector’, prepared for ACI Europe, 17 November. Belgische Mededingings Autoriteit (2020), ‘MEDE-C/C-20/0003: van Mossel Autmotive Groep4 nv/ACP Holding’, 24 February.
3 The willingness of companies to travel to customers is important in sectors such as waste collection.
4 A catchment area isochrone represents the boundaries of a local market. If, for example, it has been decided that the representative customer drives 20 minutes to a local store, the catchment area isochrone is a circle around that store in which it takes 20 minutes to get to the store.
5 Similar analysis could be conducted with respect to staff home locations if considering competition for key personnel.
6 For example, the CMA used 60% catchment areas in Greene King/Spirit Pub (2015).
7 Circle/BMI, para. 164. Oxera advised Circle Health during the CMA clearance process.
8 An iso-distance-based catchment area is similar to an isochrone-based catchment area, but it is based on travel distance (e.g. in km) as opposed to time.
9 For example, this was done in Competition and Markets Authority, Celesio/Sainsbury’s (2016), Ladbrokes/Coral (2016), and Tesco/Booker.
10 Competition and Markets Authority (2019), ‘Anticipated merger between J Sainsbury PLC and Asda Group Ltd, final report, 25 April’, paras 8.114 and 8.115.
11 Competition and Markets Authority (2020), ‘Completed acquisition by Circle Health Holdings Limited of GHG Healthcare Holdings Limited, a parent of BMI Healthcare Limited. Decision on relevant merger situation and substantial lessening of competition’, ME/6864/19, 8 April, para. 126.
12 In the case of the stylised example, if the three patients shown were the only patients of hospital A, 33.3% of patients would not see any change after the merger, for 33.3% the number of competitors would go down from four to three, and for 33.3% the number of competitors would go down from three to two.
13 For example, see Competition and Markets Authority, Celesio/Sainsbury’s (2016), Ladbrokes/Coral (2016) and Sainsbury’s/Asda (2019).
Download

Related

Modernising EU competition policy: from guidelines to outcomes
This special edition of Top of the Agenda was recorded at our 2026 Brussels conference, which hosted senior figures from the European Commission, national competition authorities, academics and the legal community to discuss one of the most significant developments in EU competition policy in two decades: the revision of… Read More

When does a discount become deceptive? An economic framework for the regulation of reference pricing
The use of ‘reference’ pricing—where a previous (or future) ‘was’ price is displayed alongside the current ‘now’ price to indicate a discount for customers—is a common feature across digital and physical markets. In supermarkets, retailers commonly advertise a headline Recommended Retail Price (RRP), or ‘was’ price, alongside the current… Read More