
Carbon prices: working together or pulling apart?
Carbon pricing is often recommended by economists as a way to reduce greenhouse gas emissions. However, in practice, several different carbon prices are used in the aviation sector. What are each of these prices, and why do they differ? And are carbon markets even working correctly?
Given the unfolding climate crisis, policies that reduce emissions from all sectors of the economy are needed, but particularly those from aviation.1 Many approaches to abating emissions have been proposed, including managing demand, offsetting and recapturing some emissions, and rolling out technological solutions that reduce emissions at source.
A key tool in incentivising emissions reduction is carbon pricing—where, for each unit of carbon emitted, the emitter has to pay a fee to the government. In principle, the advantage of carbon pricing is that it uses market mechanisms to deliver the most cost-efficient way to reduce emissions.
Sounds simple? In practice, however, airlines and airports face a range of carbon prices that differ greatly from one another, which raises the question of whether these markets are functioning correctly. We take a look at what drives the differences in these carbon prices, and identify some further questions for policymakers that are pursuing net zero in the aviation sector.
Three types of carbon pricing
The various approaches to carbon pricing in the aviation sector essentially boil down to three alternatives. These approaches—in particular, the methods by which the price is determined, the drivers of the price, and the real-world policy examples—are outlined in Figure 1.
Figure 1 Examples of carbon pricing
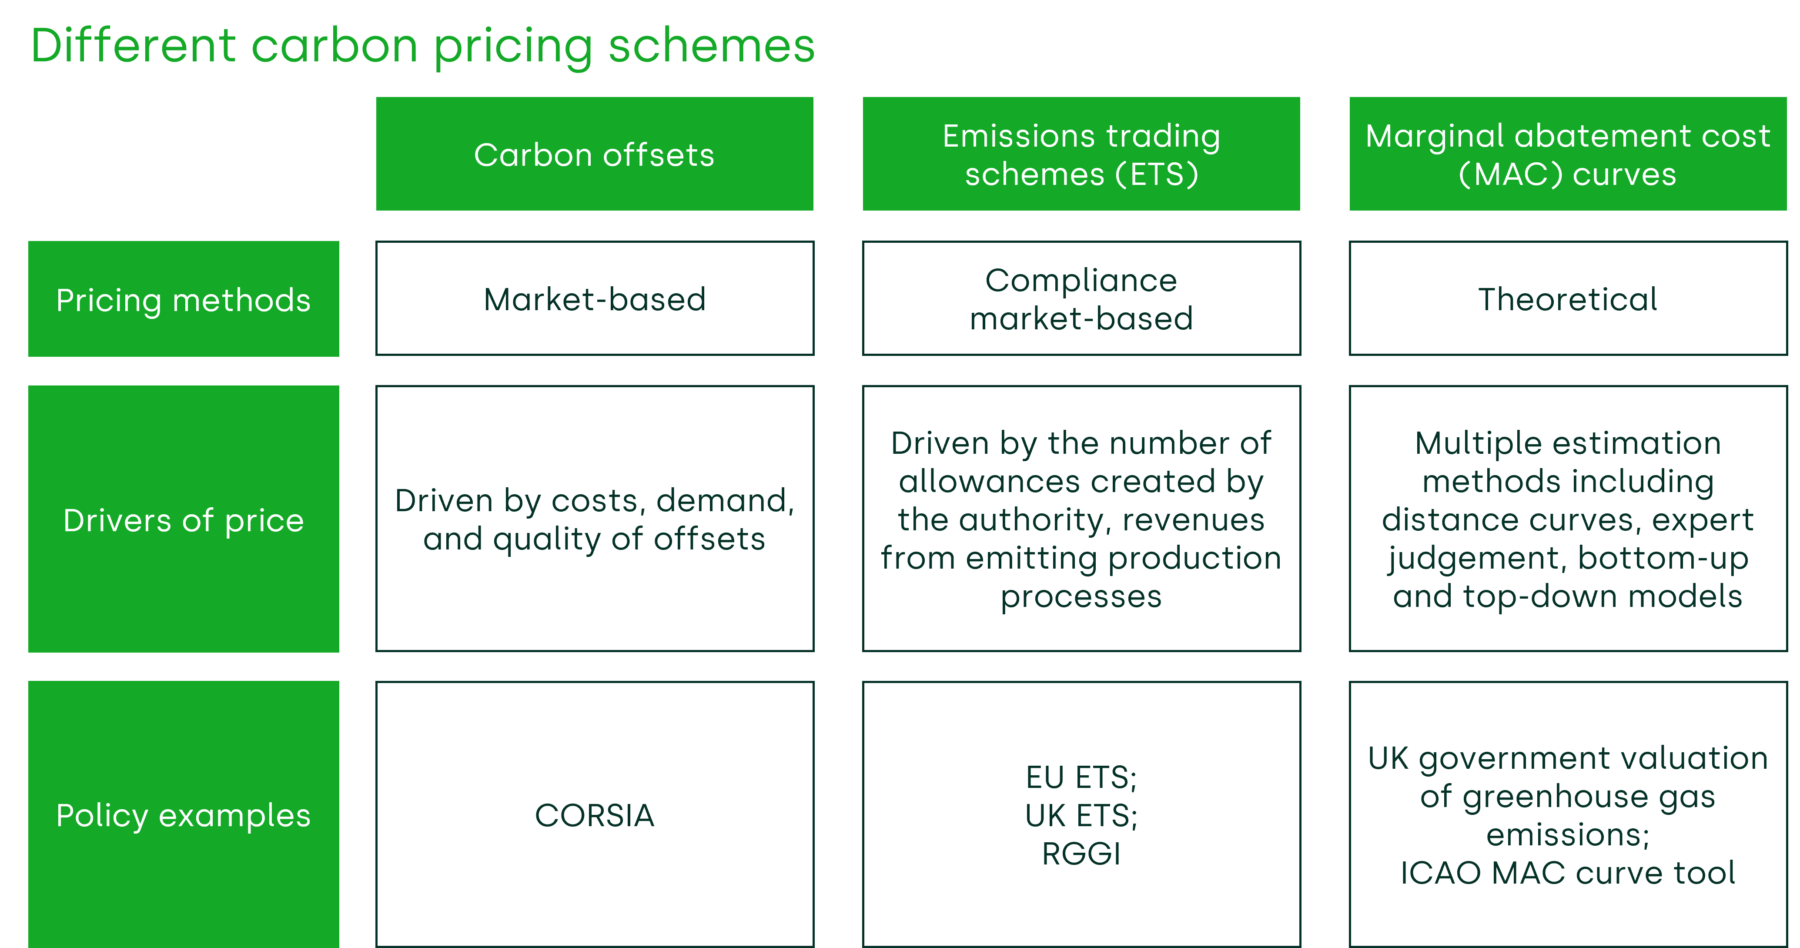
Source: International Civil Aviation Organization, ‘Carbon Offsetting and Reduction Scheme for International Aviation (CORSIA)’; European Commission, ‘EU Emissions Trading System (EU ETS)’; Department for Energy Security & Net Zero, ‘Participating in the UK ETS’; RGGI (2023), ‘The Regional Greenhouse Gas Initiative Factsheet’, January; Department for Energy Security & Net Zero (2021), ‘Valuation of greenhouse gas emissions: for policy appraisal and evaluation’, 2 September; International Civil Aviation Organization, ‘Marginal Abatement Cost (MAC) Curve Tool’.
CORSIA and carbon offsets
The International Civil Aviation Organization’s (ICAO) Carbon Offsetting and Reduction Scheme for International Aviation (CORSIA) aims to offset all growth in emissions from the aviation sector from 2019 onwards.2 This agreement requires airlines from participating countries to purchase verifiable offsets to cover the tonnes of emissions that are additional over the 2019 baseline.
Carbon offsets are tradable certificates that each represent one tonne of carbon that was either recaptured from the atmosphere, or that was not emitted. It is important that the carbon reduction is ‘additional’ or ‘incremental’—if the emissions reduction would have taken place anyway, regardless of the certificate, it cannot truly be said that the certificate represents a tonne of carbon saved. CORSIA includes specific criteria for which offsets should be considered eligible. However, these criteria have faced criticism for possible double-counting (‘over-crediting’), as well as questions over whether the credits are, in fact, additional.3
The price of these offset certificates is determined in a market by both supply (which affects the cost of recapturing or reducing emissions) and demand (which is determined by a range of external factors such as consumer preferences for offset products, and regulations requiring companies to buy offsets such as those under CORSIA).
Cap-and-trade emissions trading schemes
The European Economic Area (EEA) aviation sector is covered by the EU’s Emissions Trading System (ETS).4 This is a cap-and-trade system that grants a certain number of allowances to the aviation sector, and allows these to be traded with other sectors. The EU ETS guarantees that emissions do not exceed the cap, as firms must cover their emissions with the required number of allowances. Failing to do so will lead to a fine, as well as a continued obligation to purchase the allowances.
As a result, prices are determined by the marginal abatement cost (MAC, i.e. the cost of reducing carbon emissions by one unit) of all the sectors covered. Given that aviation has proved to be a sector that is difficult or costly to abate, the aviation sector may purchase unused allowances from different sectors such as energy or road transport.5 In this way, emissions trading schemes are ‘technologically neutral’. Such schemes tend to be favoured by policymakers when the future development of technology and costs are highly uncertain.
Currently, however, the EU ETS covers only flights to and from an airport in the EEA. One policy development is that the free allowances that are currently available under the ETS will be removed in future years, meaning that the total cost of the scheme for airlines will increase.6 In the future, the Commission will consider whether to extend the EU ETS to departing flights, depending on its assessment of whether CORSIA is sufficiently delivering on the goals of the Paris Agreement.7
Marginal abatement cost curves
Finally, another way to price carbon is to set it at an estimate of the marginal cost of reducing emissions by one more unit—the MAC.
These costs vary depending on the extent of the emissions that need to be abated. As the first units of emissions may be easy to abate as the technologies already exist, the only costs relate to rolling these out.8 This is the ‘low-hanging fruit’. As these easier and less costly options are exhausted, the MACs of reducing emissions via other technologies, or in other sectors, become more expensive. The difference in MACs across different industries, and at different levels of emissions, is the reason why cap-and-trade systems such as the EU ETS are popular. They allow for the cheapest reduction of emissions, as the price of an allowance is bid up until the sector that is easiest to abate finds it less costly to reduce its emissions.
MACs are estimates, not real prices that are ever actually paid. As such, they rest on theoretical assessments of how costly it is to reduce emissions.9 Organisations such as the UK government produce estimates of MAC costs over time, which can be used in policy appraisal.10 These can be included in cost–benefit analyses to weigh up whether policies should be implemented when including both their direct and indirect, or private and social, costs.
A MAC curve can be developed for the aviation sector, whereby different technologies and policy options, the resulting emissions-savings potential, and the cost of implementing the measures can be compared. ICAO member states have created plans for the decarbonisation of the aviation sector.11 A stylised example of a MAC curve for the aviation sector based on the UK’s aviation decarbonisation plan is outlined in Figure 2.
Figure 2 Stylised example of a MAC curve for the aviation sector
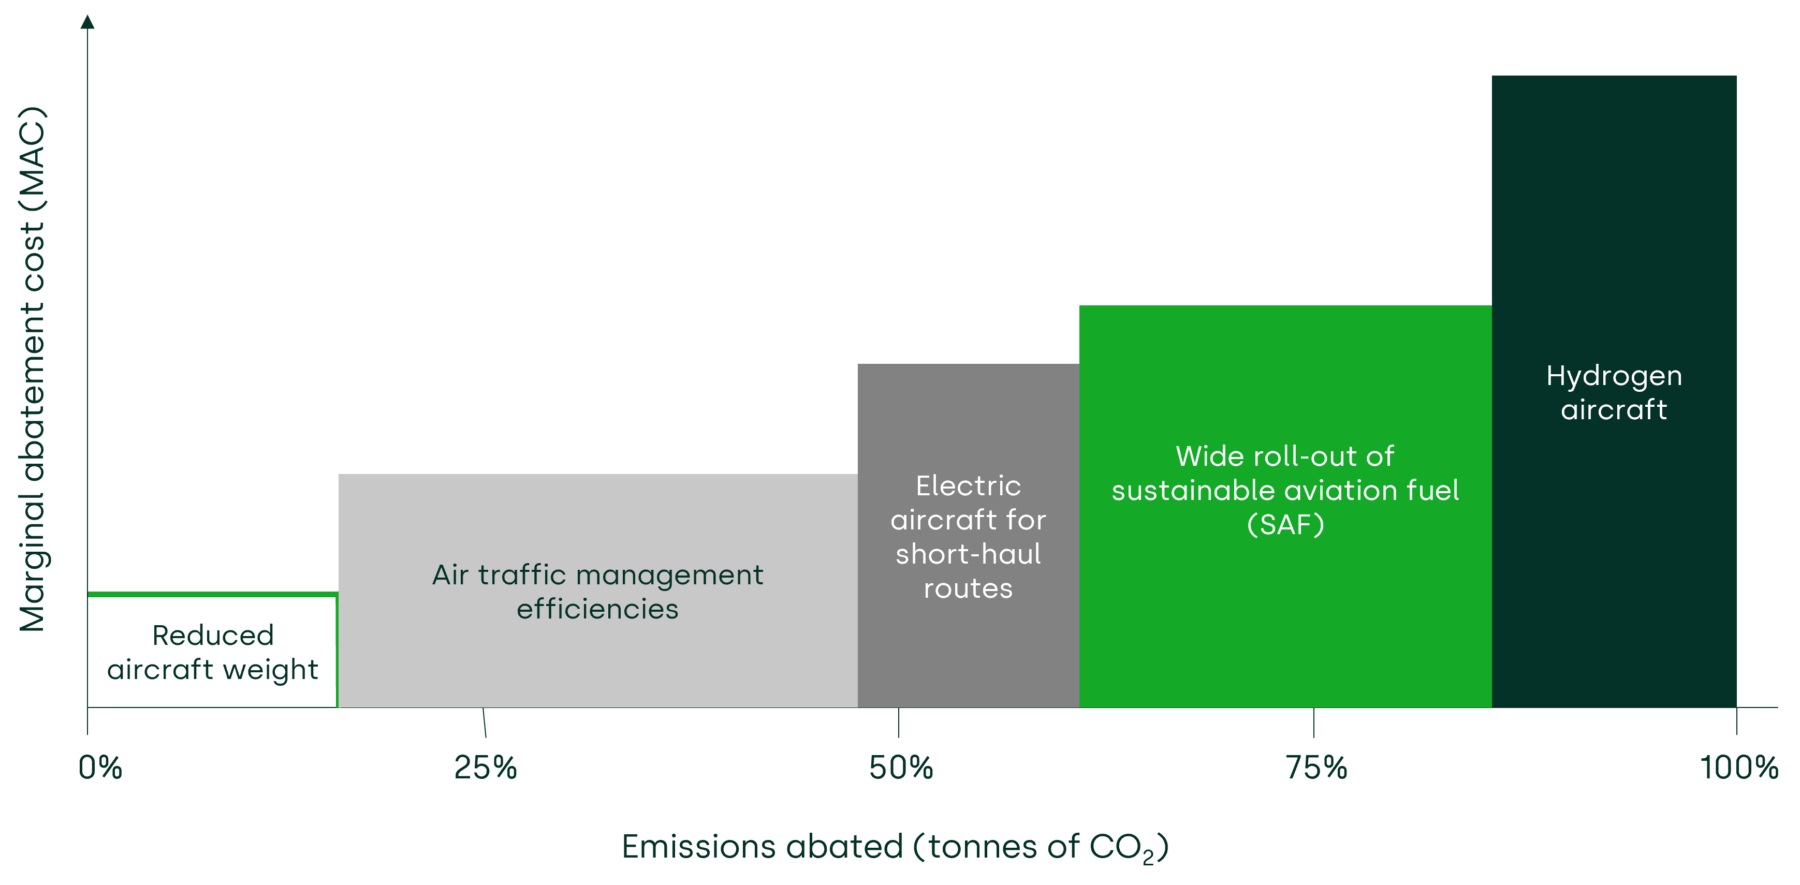
Source: Oxera, based on Department for Transport (2021), ‘UK State Action Plan on International Aviation CO2 Emissions Reduction Activities’ (last accessed 18 July 2023).
Should these prices match?
As noted above, carbon prices seen under different schemes and approaches vary widely. The range of some carbon prices is outlined in Figure 3 below.
Figure 3 Range of carbon prices
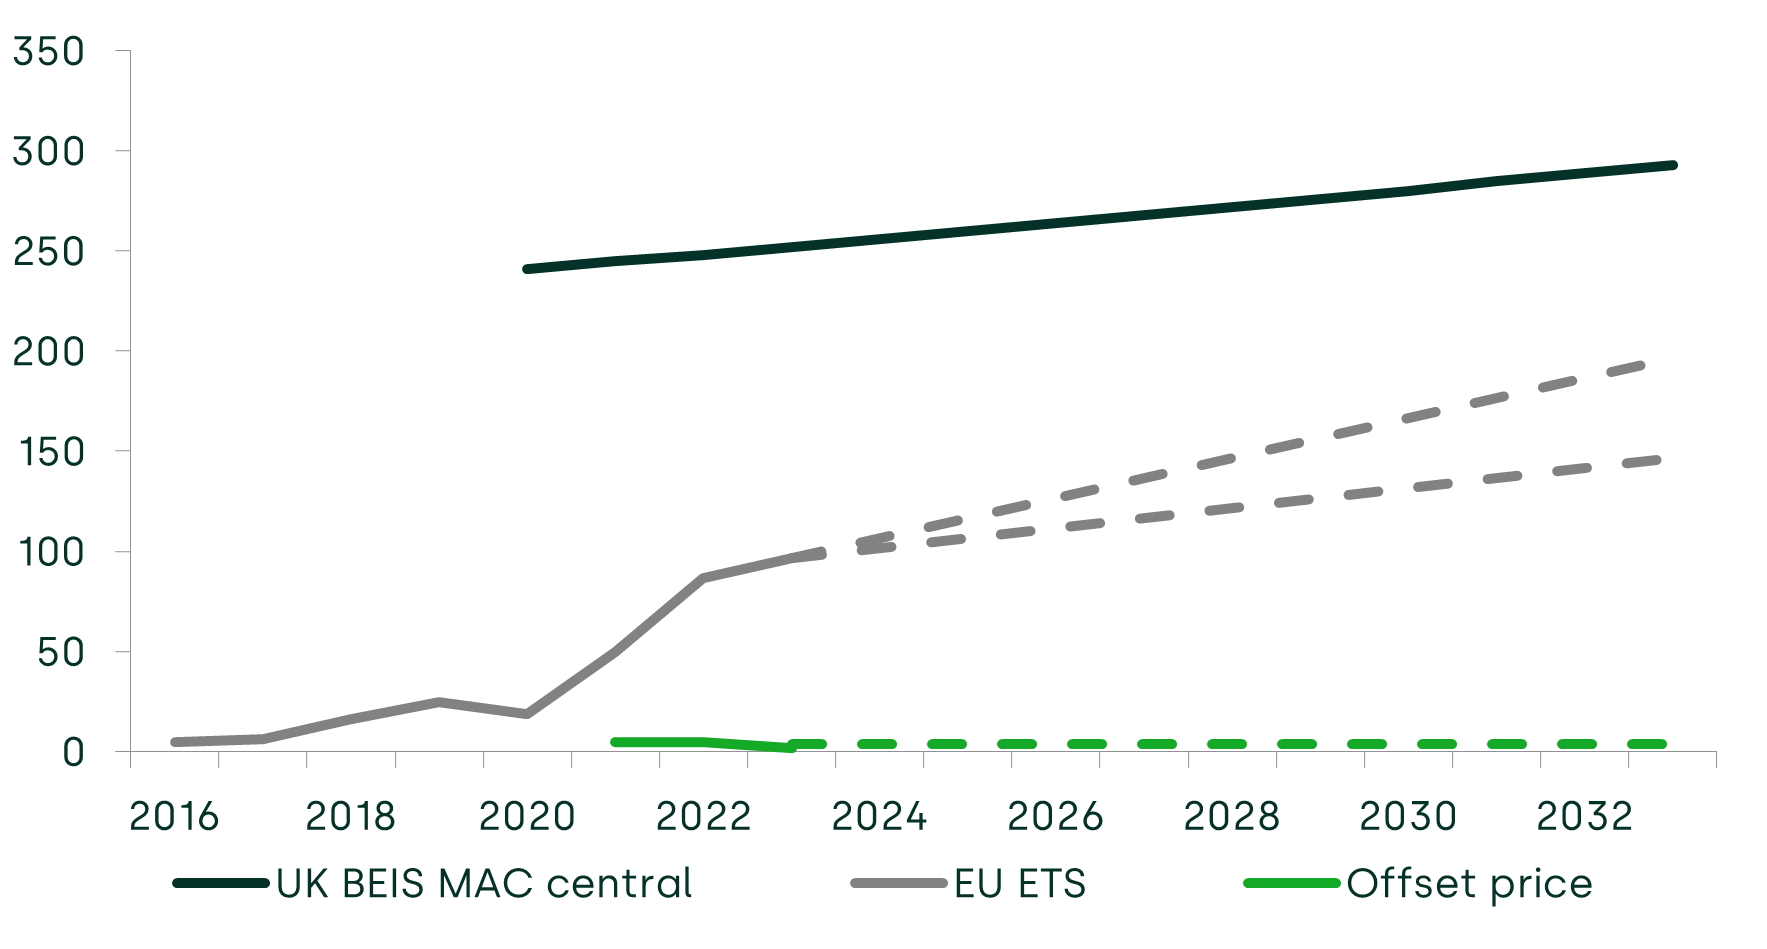
Source: Oxera analysis; Department for Energy Security & Net Zero (2021), ‘Valuation of greenhouse gas emissions: for policy appraisal and evaluation’; World Bank, ‘Carbon Pricing Dashboard’; Bloomberg Finance L.P. (2023).
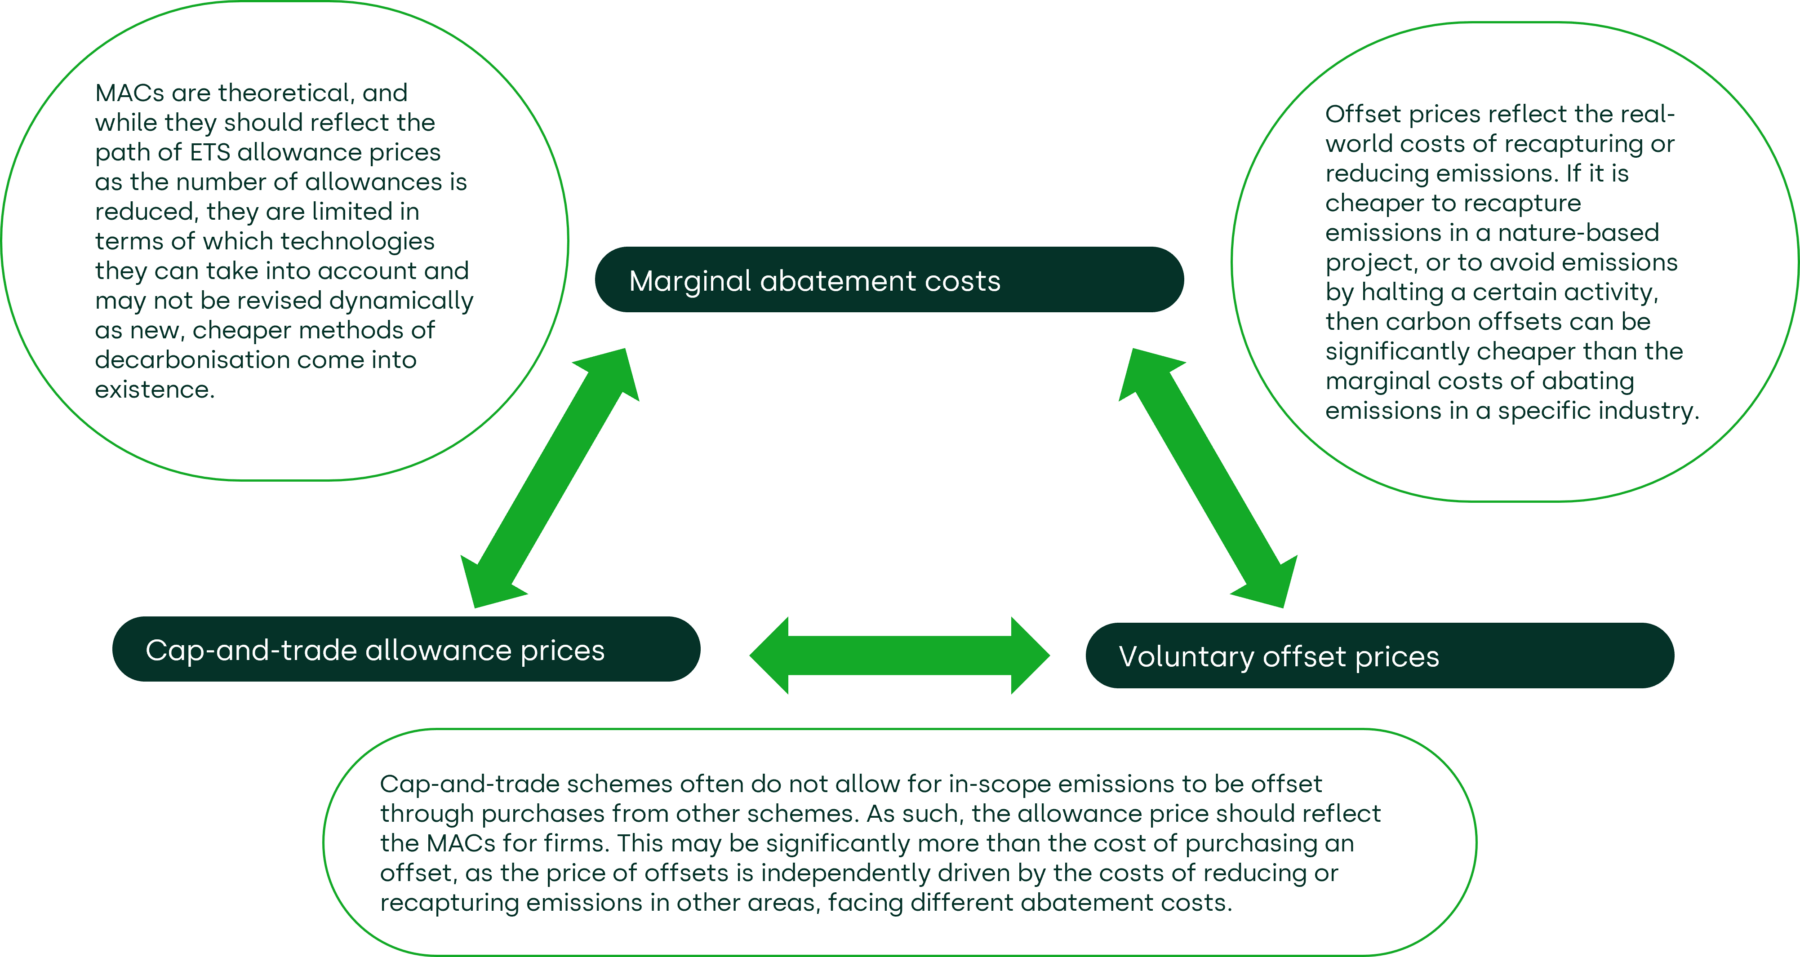
However, given that they are in effect measuring different things, there are good reasons why such prices may differ. These reasons are outlined in Figure 4 below.
Figure 4 Interactions of different carbon prices
There are also a number of issues that could be driving differences in prices, as follows.
- Tradable offset schemes and, in particular, CORSIA, have come under scrutiny for several reasons, such as the quality of the offsets and whether they are additional. In particular, many of the projects underlying CORSIA credits may continue abatement regardless of whether they can sell offset credits, meaning that the emissions reductions may have happened anyway—with or without CORSIA.12
- EU ETS prices have historically been volatile. They have risen from around €20 per tonne of emissions in early 2020 to a range of around €80–100 in 2023.13 In principle, higher ETS prices may drive decarbonisation more quickly by incentivising investments in low-carbon technologies. However, within the aviation sector, decarbonisation technologies such as the use of sustainable aviation fuels, or hydrogen aircraft, are still in nascent stages of development, and will require significant additional investment and time before they can be deployed at scale. This is likely to take place only if there is an expectation that ETS prices will increase to levels such that these technologies become commercially viable. For example, the abatement costs of sustainable aviation fuel are around €240–700 per tonne of CO2.14
- As MACs are theoretical, they can be too narrowly scoped and can quickly become out of date. This can be damaging if they are used in policy appraisal and lead to incorrect policies being enacted—as the mispricing of carbon in government policies may lead the government to be too lenient (causing sub-optimally high emissions) or too stringent (leading to reduced incomes).
In addition, different carbon prices are used in different situations, which could lead to inconsistent incentives across different parts of the aviation sector. For example, EU ETS prices, which apply to intra-EEA flights, are higher than the cost of CORSIA credits, which apply to flights between the EEA and other participating countries. The EU’s Fit for 55 proposals may lead to a risk of carbon leakage, as set out in Oxera’s June 2022 report assessing the effects of the proposals on the aviation sector.15 They also mean that those on shorter flights would pay a higher carbon tax than those on longer flights, even though the latter category is more carbon-intensive.
Not the only tool in the toolbox
We have discussed one way in which firms could be incentivised to decarbonise, namely by enforcing a carbon price that captures the external or social impacts of carbon on the environment. While this is, in principle, an effective way to achieve decarbonisation, multiple carbon prices exist, each of which faces a different set of issues. Additionally, not all of the elements of the aviation value chain are subject to carbon pricing.
This suggests that, while carbon prices may remain an effective and essential tool for reducing emissions, other measures are also needed.
This discussion also raises questions regarding the design of alternative measures to carbon pricing. Carbon pricing is a technology-neutral way to incentivise decarbonisation. However, if other measures are needed to support decarbonisation, to what extent should regulators and governments involve themselves in the process of selecting and supporting technologies that can help the aviation sector to decarbonise?
These topics will form the basis of future Agenda articles in the coming months.
1 Although aviation is responsible for only a small proportion of total European emissions (3.8%), demand for air travel is expected to grow rapidly in the coming decades, with emissions possibly tripling between 2015 and 2050. For more information, see European Commission, ‘Reducing emissions from aviation’ (last accessed 21 July 2023).
2 International Civil Aviation Organization (2023), ‘Carbon Offsetting and Reduction Scheme for International Aviation (CORSIA)’.
3 International Civil Aviation Organization (2019), ‘CORSIA Emissions Unit Eligibility Criteria’, March. Transport & Environment (2021), ‘Corsia: worst option for the climate’, March, pp. 4–5.
4 European Commission (2023), ‘Reducing emissions from aviation’.
5 International Council on Clean Transportation (2021), ‘The Steep Descent to Net-Zero Aviation’, 8 March.
6 European Parliament (2023), ‘Revision of the EU Emissions Trading System for aviation: Recital 14’, 18 April.
7 European Commission (2022), ‘European Green Deal: new rules agreed on applying the EU emissions trading system in the aviation sector’, 9 December.
8 In fact, the first MACs are often negative. This may be because there are operational changes that actually reduce both resource costs and emissions as a result. An example of this would be an airline reducing excess weight on its aircraft, or no longer offering a certain product on board.
9 For a further description of how different MACs are estimated, see Hintermayer, M., Schmidt, L. and Zinke, J. (2020), ‘On the time-dependency of MAC curves and its implications for the EU ETS’, November, pp. 3–5.
10 Department for Business, Energy & Industrial Strategy (2021), ‘Valuation of greenhouse gas emissions: for policy appraisal and evaluation’, 2 September.
11 International Civil Aviation Organization, ‘State Action Plans and Assistance’ (last accessed 21 July 2023).
12 New Climate Institute (2019), ‘Offset credit supply potential for CORSIA’ (last accessed 14 July 2023).
13 Ember, ‘Carbon Price Tracker’ (last accessed 25 July 2023).
14 Department for Transport (2021), ‘Jet Zero Consultation: evidence and analysis’, para. 2.8.
15 Oxera (2022), ‘Assessment of the impact of the Fit for 55 policies on airports’, prepared for ACI EUROPE, 30 May.

Related

Modernising EU competition policy: from guidelines to outcomes
This special edition of Top of the Agenda was recorded at our 2026 Brussels conference, which hosted senior figures from the European Commission, national competition authorities, academics and the legal community to discuss one of the most significant developments in EU competition policy in two decades: the revision of… Read More

When does a discount become deceptive? An economic framework for the regulation of reference pricing
The use of ‘reference’ pricing—where a previous (or future) ‘was’ price is displayed alongside the current ‘now’ price to indicate a discount for customers—is a common feature across digital and physical markets. In supermarkets, retailers commonly advertise a headline Recommended Retail Price (RRP), or ‘was’ price, alongside the current… Read More