
Bidding for a more sustainable future: carbon trading in the EU
In the context of a rapid increase in global energy and carbon prices since September 2021, questions have emerged around the functioning of the EU carbon market and the role of carbon prices in public policy. How can we assess whether the carbon market is functioning well? What does the evidence tell us, and is there a need for further policy intervention?
This article draws on economic analysis carried out by Oxera for ICE. See Oxera (2022), ‘Carbon trading in the EU’, 15 February, commissioned by ICE (hereafter ‘our report’).
Oxera was asked by ICE to evaluate the EU carbon market in light of the sharp increase in prices and concerns from some politicians about the role of speculators in the market.1 This article introduces the topic of carbon trading and summarises the conclusions of our report.
What is a cap and trade system?
A cap and trade system is a cost-effective way of reducing greenhouse gas emissions. The policymaker sets a ‘cap’ on emissions and creates allowances for each unit of emissions under the cap. EU allowances (called ‘EUAs’) permit one tonne of carbon dioxide equivalent (tCO2e) to be emitted each.2 The cap typically declines over time, providing a growing incentive for industry and businesses to reduce their emissions and to keep their production costs down.
‘Trade’ refers to the buying and selling of allowances undertaken by companies, with supply and demand setting the EUA price. The ability to trade EUAs provides a strong incentive for firms, individually and collectively, to reduce emissions in the most cost-effective way.
Under the EU Emissions Trading System (ETS), the EU distributes allowances to companies in sectors that need to comply with the EU ETS, either for free or through primary auctions. Each year eligible companies within the scope of the EU ETS are allocated an allowance proportionate to their historic emissions, which can then be bought and sold on the secondary market. Any shortfall in allowances held by companies relative to their actual emissions must be purchased in the primary EUA auctions or in the secondary markets.
By assigning a price to carbon-intensive activities, the cap and trade system provides a financial incentive for firms to reduce their emissions while lowering the overall costs of these reductions by adopting the lowest-cost abatement options. As long as it is cheaper for companies to decarbonise than to buy additional EUAs, they would be expected to invest in less polluting production processes and efficiency.
Why does there need to be a carbon market?
Reducing greenhouse gas emissions is crucial in the fight against climate change. A carbon market puts a price on carbon to reflect the social costs of emitting greenhouse gases, and the sale of allowances generates revenue for governments that can be used to fund other climate change policy measures or support businesses and consumers in the energy transition to net zero carbon emissions.
For example, if a company expects that its future emissions will exceed its available allowances, it will be required to buy more allowances in the carbon market. Conversely, if it is implementing measures to reduce emissions, it may sell any excess allowances on the market.
Markets for the trading of EUAs, as well as futures contracts and other derivatives tied to EUAs, give companies additional flexibility. Carbon trading increases the pool of available capital to enable companies to cut emissions faster, and rewards innovation.
Why does the carbon price change over time?
The carbon price is determined by supply and demand. Prices rise and fall depending on factors such as climate and energy policy reforms, macroeconomic developments, and the costs of emission reductions.
In the presence of government commitments to reduce greenhouse gases in the atmosphere, the supply of EUAs in the market must fall over time. Other things being equal, as the supply of EUAs steadily reduces to meet the 2030 and 2050 climate change commitments, the price is expected to rise, as shown in Figure 1 below.
The price increase since September 2021 can be attributed in large part to (i) the effects of EU ETS reforms aimed at achieving a progressively tighter cap on emissions; (ii) higher gas prices triggering a switch from gas-fired to coal-fired generation; and (iii) the impact of the COVID-19 recovery. The price decrease in March 2022 follows heightened geopolitical risks as a result of the situation in Ukraine and evolving market expectations about the future demand and supply of EUAs in light of the events and associated policy responses.
Figure 1 EU carbon price and market forecasts for 2030
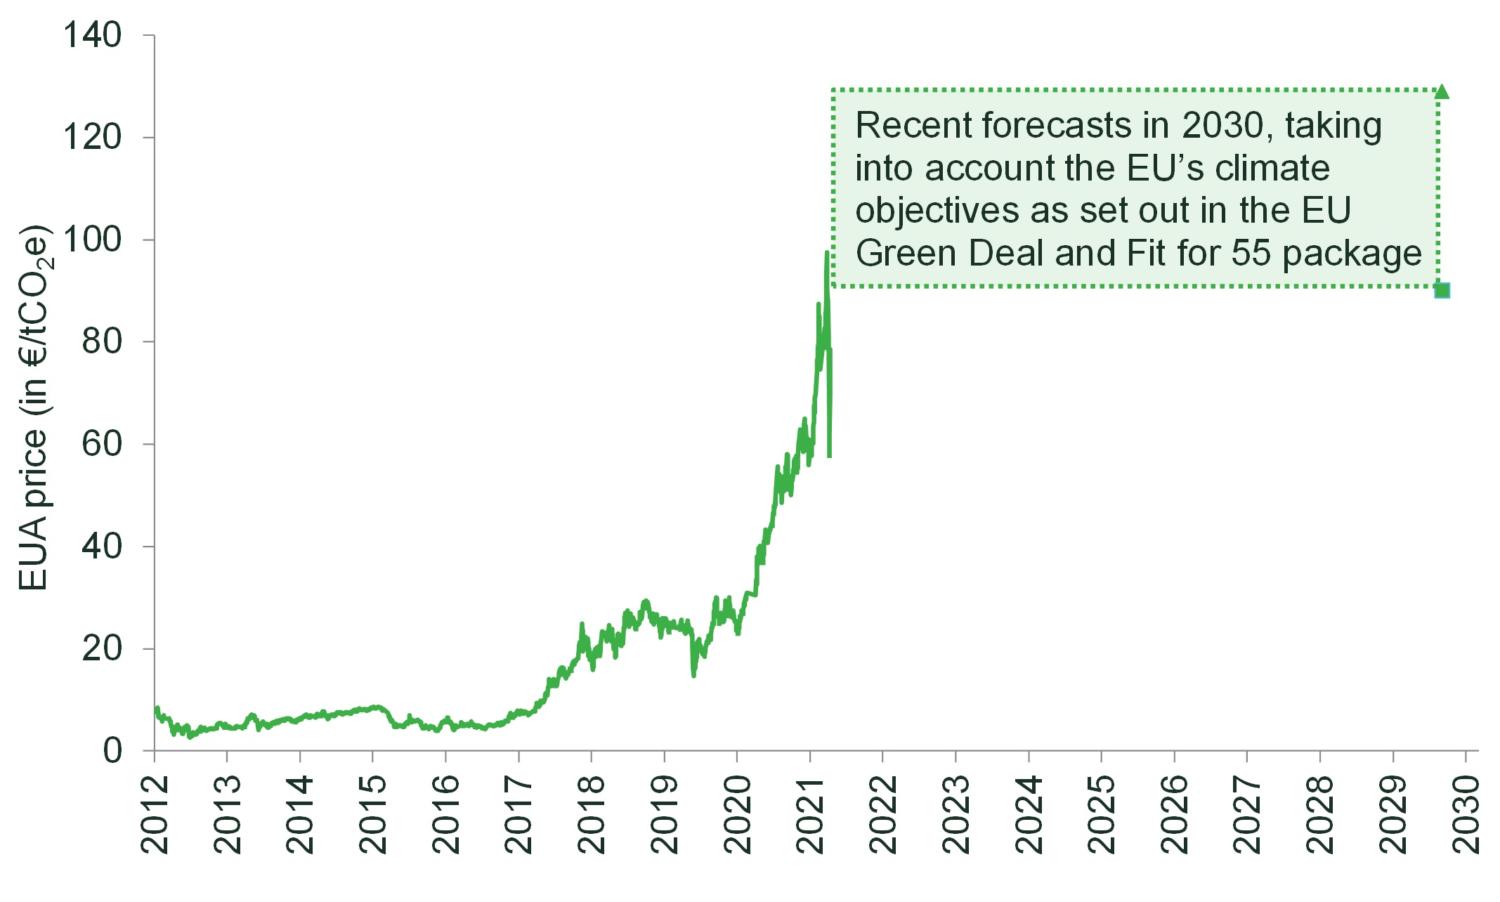
Source: Oxera analysis based on EU ETS auction prices, and price forecasts from ICIS and PIK. Euractive (2021), ‘Analyst: EU carbon price on track to reach €90 by 2030’, 19 July; Pietzcker, R. (2021), ‘Tightening EU ETS targets in line with the European Green Deal: Impacts on the decarbonization of the EU power sector’, Applied Energy, 293:1, July.
Why do we need financial institutions in the carbon market?
As shown in Figure 2 below, financial institutions participate in the market to take positions and to facilitate trading between counterparties. They are integral to the successful functioning of the carbon market.
Figure 2 Benefits of carbon trading to end-users
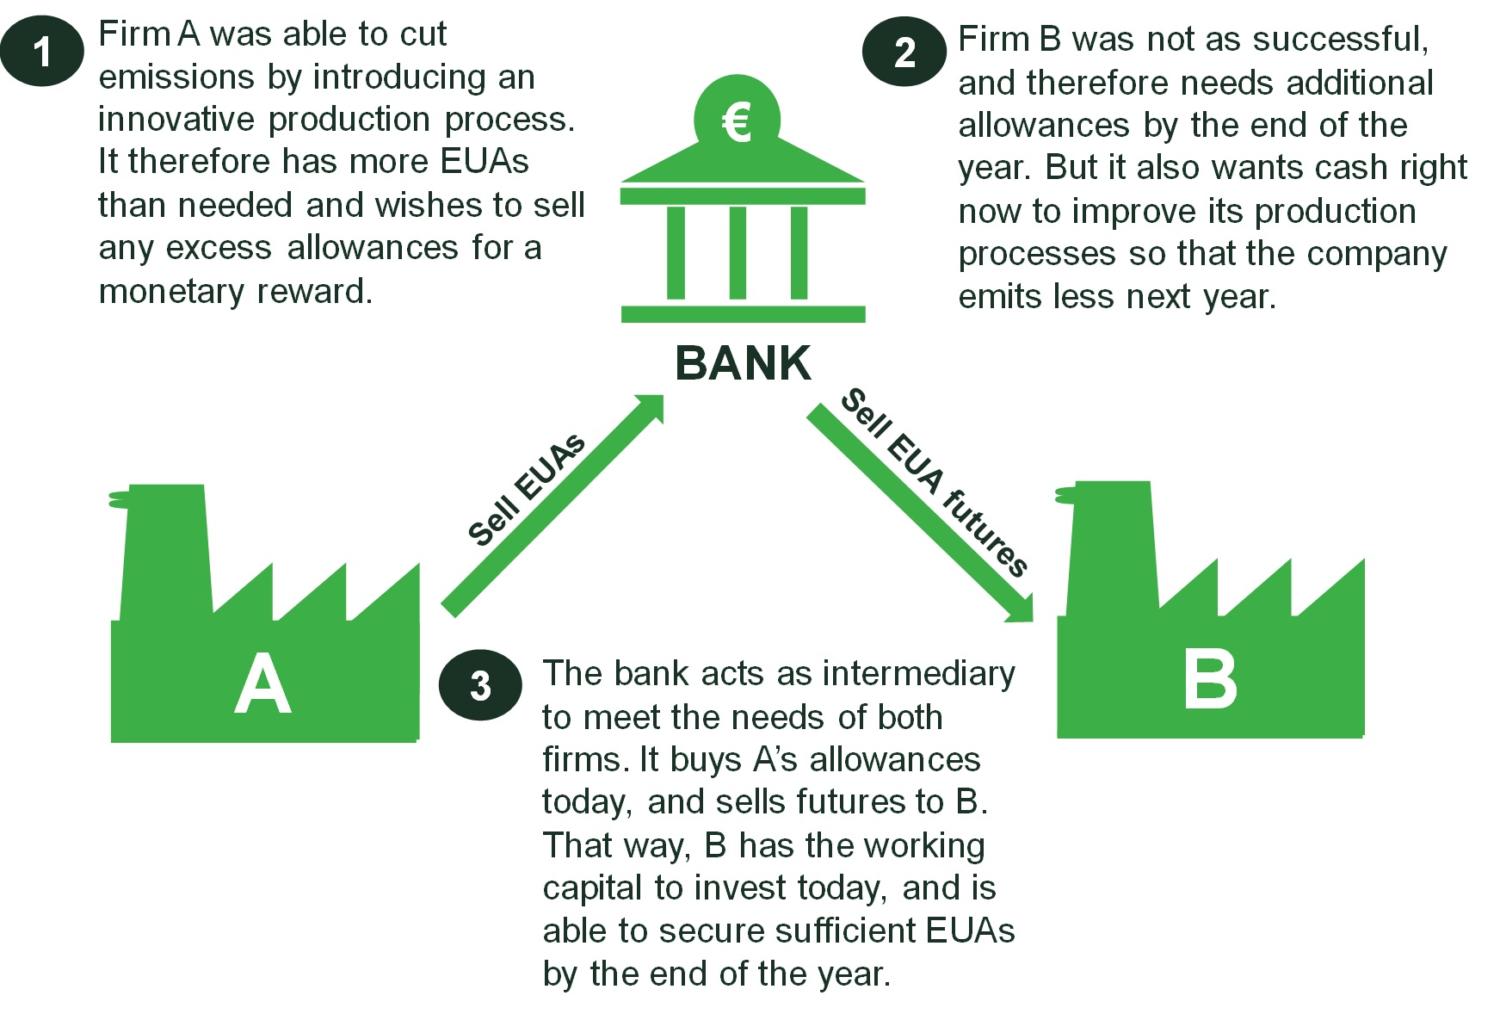
It is widely recognised in the literature that, for markets to function well, financial institutions (or ‘speculators’) are needed to take the opposing positions to hedgers to allow the hedgers to reduce their risk exposure.
This is even more the case in the carbon market, where there is generally only one supplier of emissions allowances (the government), while there are many natural buyers (whose emissions are covered by the EU ETS) that often seek to hedge their carbon price risk.3
By opening up trading opportunities to a broader, more diverse group of market participants, the carbon market has become more resilient, easier and less costly to access, and better at providing risk-management solutions to companies.4
As the number of trading firms has grown, the concentration of the market has reduced. The normalised Herfindahl–Hirschman Index (HHI) of net positions in EUA futures reduced from 0.0421 in October 2018 to 0.0303 in October 2021.5 The increase in the number of trading firms has also been associated with a reduction in the relative cost of trading EUA futures (calculated as the average quoted spread divided by the closing price) and has fallen, as shown in Figure 3 below. This compares to previously observed trends of falling absolute and relative costs during earlier phases of the EU ETS.6 Without financial institutions acting as liquidity providers, it is likely to be more costly and challenging for non-financial firms to trade emissions allowances.
Figure 3 Number of traders and relative cost of trading EUA futures
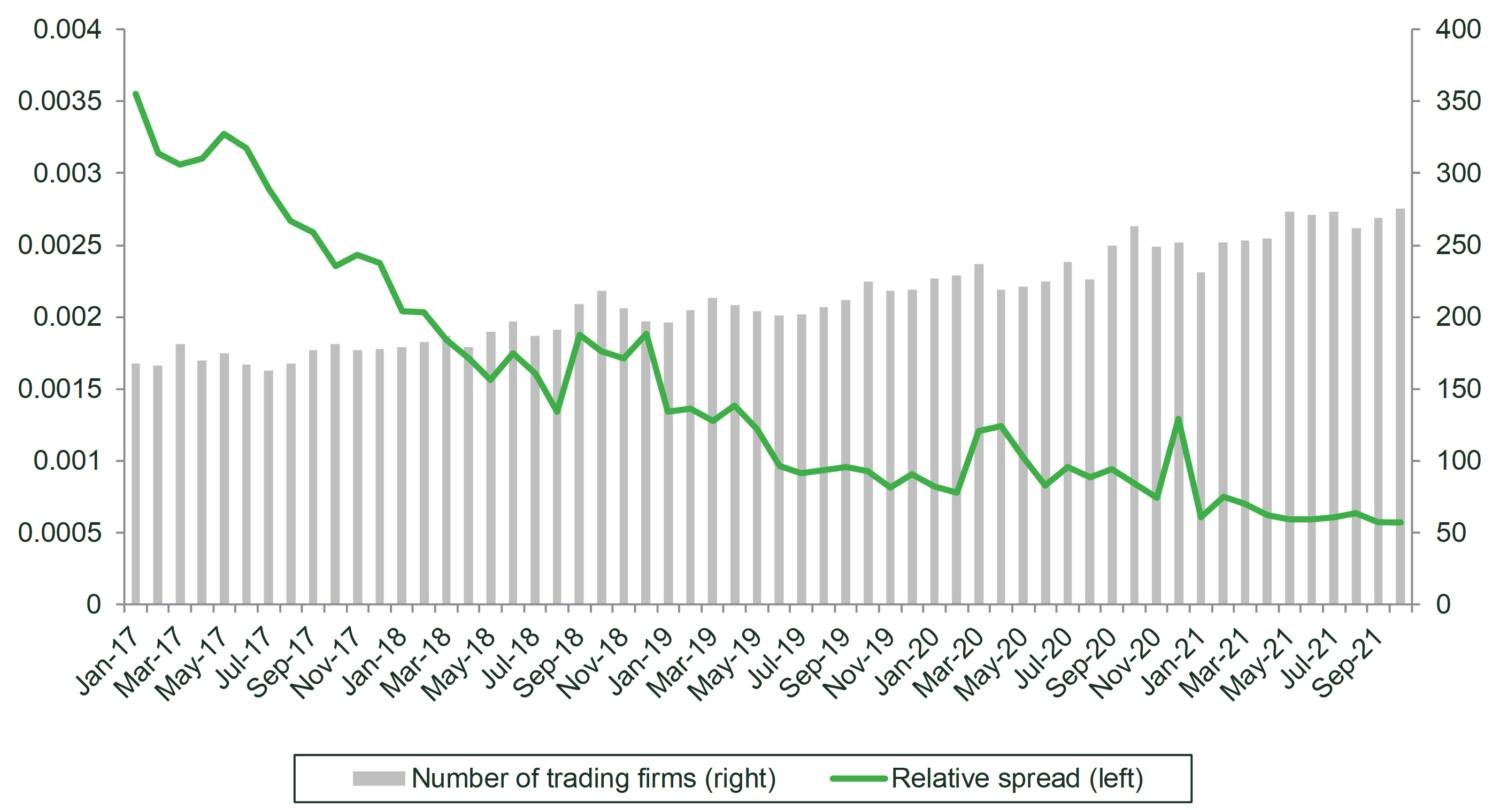
Source: Oxera analysis of ICE data.
Financial institutions have also supported the development of derivative contracts tied to EUAs, which offer effective tools for hedging and risk management. The global energy price increases in 2021 highlighted the benefits of hedging and risk management. Firms that are well hedged have continued to operate and serve their customers. Others without prudent hedging strategies, such Bulb Energy in the UK, have failed as a result.7
How are emissions allowances different from other commodities?
Several unique features of EUAs make it harder for a trader to exercise market power or otherwise distort the carbon price, compared with other commodities.
First, EUAs are ‘bankable’ across EU ETS phases and compliance periods (calendar years). As a result, the quantity of EUAs in circulation that can be used to fulfil derivatives contracts or meet compliance obligations is currently much larger than the total volume of EUA derivatives with expiry in a given year.
Second, the actual surrender of EUAs for compliance purposes occurs only once per year (on 30 April). This is in contrast, for instance, to the power market, where the underlying commodity needs to be made available every hour and where the costs of unexpected deviations from planned generation or demand are costly. To squeeze the power market, a market participant potentially needs to be pivotal in a given hour only, while to corner the EUA market a participant needs to hold a substantial proportion of the total stock of allowances in circulation.
Third, the trading of EUAs involves only negligible storage and transport costs. In contrast to commodities, cornering the market for EUAs is more difficult because any market participant can supply allowances to any other participant immediately and without significant costs.
Finally, supply and demand of emissions allowances are ultimately set by governments. Prices are therefore often a reflection of the policymakers’ level of commitment at a given point in time. Unlike other commodities, it is relatively straightforward for governments to change supply in the event of excessive price movements or other disruptions.
Is there a need for policy intervention in carbon trading?
There is no clear need for significant policy intervention at this point. The evidence in our report indicates that the market is functioning well and as intended.8
- For instance, prices are responsive to supply and demand conditions, and market outcomes are consistent with the overall objectives of EU climate policy.
- Greater participation of financial institutions has improved overall liquidity, price formation and market resilience.
- Further, there are no clear signs of market manipulation. Any concerns should be assessed under the existing rules, with the associated penalties. The European Security and Markets Authority’s assessment did not identify any major abnormalities in the functioning of EU carbon market and concluded that price movements and volatility appear to be driven by supply and demand dynamics, the structural decline in allowances, and rising energy prices.9
Carbon trading is a well-regulated market in the EU, subject to a comprehensive set of rules following from EU financial regulation, including the EU’s revised Directive and Regulation on Markets in Financial Instruments (MIFID II/MiFIR), Market Abuse Regulation (MAR) and European Market Infrastructure Regulation (EMIR).
After many years of incremental improvements, the EU ETS is now seen as a global benchmark for carbon trading and a success that other regions are seeking to follow.
The risks of adverse unintended consequences from poorly targeted, unjustified or disproportionate interventions are material.Interventions such as restricting market access to compliance buyers (as recently proposed by some politicians) could impair the efficient functioning of the EU ETS.
Although there is no clear justification for further policy intervention at this stage, ongoing market monitoring is required given the scale of policy reform currently envisaged and increasing investor interest in carbon markets.10
It would be beneficial for supervisors to improve their ability to monitor these market developments, for example by:
- improving the consistency of positions reporting—further guidance from ESMA would help;
- improving the access of relevant financial regulators to real-time data on investors’ EUA holdings. This would facilitate market surveillance.
Ensuring the smooth functioning of the carbon market will remain crucially important as policymakers strive to meet their climate targets and support the transition to net zero in the years ahead.
1 See, for example, Reuters (2021), ‘German utility Stromio asks regulator to limit EU carbon market speculators’, 8 September; and Nowacki, M. (2021), ‘The chronicle of a crisis foretold: Price bubbles in the EU’s CO2 emissions trading scheme’, The Parliament Magazine, 6 December.
2 Carbon dioxide equivalent (CO2e) is a measure of how much a gas contributes to global warming relative to carbon dioxide.
3 This is in contrast to many other commodity markets, where it is typical to have both producers and consumers of the commodity who seek to hedge their price risks. The producers, who are naturally long the commodity, hedge by selling futures. The consumers, who are naturally short the commodity, hedge by buying futures. The diversity of trading interests in turn helps to facilitate liquidity.
4 See section 4 of our report.
5 Oxera analysis of ICE data. HHI is a common measure of market concentration and is used to determine market competitiveness. Normalised HHI is calculated as the sum of market shares squared of all participants in the market, divided by 10,000, and ranges between 0 (perfect competition) and 1 (monopoly). According to ESMA and the European Commission’s guidelines (in the context of competition law), an HHI value of below 0.1 indicates low concentration and an HHI value of between 0.1 and 0.2 indicates medium concentration. See Figure 4.4 in our report.
6 Ibikunle, G., Gregoriou, A., Hoepner, A.G.F. and Rhodes, M. (2016), ‘Liquidity and market efficiency in the world’s largest carbon market’, British Accounting Review, 48:4, pp. 431–47.
7 O’Dwyer, M. and Thomas, N. (2022), ‘UK energy supplier Bulb’s hedging strategy led to collapse, report shows’, Financial Times.
8 See section 4 of our report.
9 European Security and Markets Authority (2021), ‘Final Report: Emission allowances and associated derivatives’, ESMA70-445-38, 28 March.
10 Policy reforms under consideration include the removal of excess allowances, the phasing out of free allowances, a faster pace of emission reductions, the potential integration of negative emissions technologies, increased sector coverage, and potential linking of the EU ETS with other schemes and/or the emergence of an international carbon market.
Download

Related

No water, no growth: tackling inefficient business water demand
Water is not typically thought of as a constraint on economic growth in England. Yet that is precisely what it is becoming. Commercial growth and new developments are being turned away because there is insufficient water to serve them. Some water companies are already exercising their powers to refuse… Read More

The energy trilemma in focus: the price of dependence
Europe’s approach to energy policy has been in transition since the 2022 energy crisis laid bare the continent’s dependence on imported fossil fuels. More recently, the outbreak of war in the Middle East and the subsequent disruption to global oil and gas markets have caused further challenges. This article… Read More