
A ‘new normal’: airport competition in Europe
The last few years have seen a significant expansion in the European aviation sector. Between 2010 and 2016, the number of seats available on flights to, from or within Europe grew by 285m (equivalent to a 25% increase in capacity).1 The main drivers of this growth are well known and have been widely reported—in particular, the continued proliferation of LCCs, and the rapid expansion of ‘super connectors’ (Emirates, Qatar, Etihad and Turkish Airlines).
Indeed, Figure 1 below shows that, across airports of all sizes—from those serving fewer than 5m passengers per annum (mppa) to those serving over 40mppa—the single largest driver of capacity increases has been non-traditional airlines: those that are not members of airline alliances, and that are most likely to be LCCs.
Figure 1 Share of growth by type of airline 2010–16, by airport size (mppa)
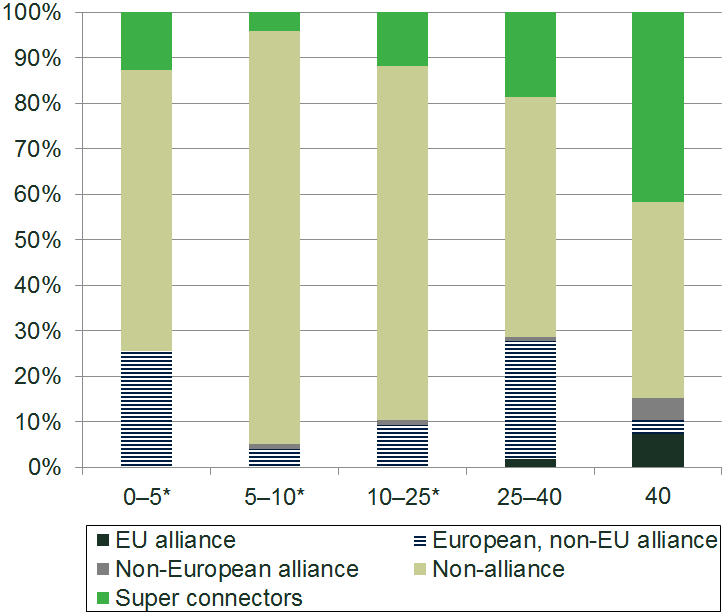
Source: Oxera analysis of OAG data.
Non-alliance airlines and super connectors combine to account for 86% of all capacity growth over this period. In the context of more specific geographic regions this conclusion is even more dramatic: for intra-EU traffic only, traditional alliance airlines have shrunk, meaning that all net growth is attributable to the non-traditional carriers.
While the drivers of this growth are well known,2 their impact on competition between airports has been less widely analysed. Previous ACI EUROPE publications have concluded that the behaviour of airlines and passengers led to dramatic shifts in the competitive environment faced by airports over the years up to and including 2010. However, the developments in the European aviation industry since 2010 have changed this picture further.
With this in mind, ACI EUROPE commissioned Oxera to examine how airport competition has developed since 2010. Our analysis focused on three main ways in which airports compete with each other to attract and retain: (i) airlines; (ii) transfer passengers; and (iii) passengers flying to or from their local area. Our study considered high-level trends across Europe: to understand the competitive position at any particular airport in detail would require an assessment of the competitive environment surrounding that airport.
Competition for airline services
Airports earn both aeronautical revenues (those charged to airlines on a per-passenger or per-aircraft basis) and non-aeronautical revenues (for instance, via retailers in terminal buildings). Both of these revenue streams tend to grow as passenger volumes grow—incentivising airports to attract more passengers by increasing the number and range of airline services from the airport.
Airlines’ primary assets (the aircraft) are, of course, mobile. This means that airlines have a choice of routes on which they can operate services and, as commercial entities, they will seek to operate those likely to be most profitable. This logic applies to both new capacity and changes in the allocation of current capacity (e.g. shifting aircraft from under-performing routes to those that are expected to yield a higher return). Therefore, to maximise their commercial appeal to airlines, airports must strike a balance between offering airlines both low costs (through low aeronautical charges and efficient operations) and attractive yields (sufficient demand).
Airports must also consider their long-term relationships with airlines as, compared with many industries, they directly serve a relatively small number of customers. We used case studies of several airports to understand the negotiation process between airlines and airports. We found evidence of airports lowering costs to airlines (typically through the provision of discounts and other incentives for any form of incremental traffic). We also found that airports were investing substantial effort in demonstrating their commercial potential to airlines—for instance, by conducting demand analysis to prove the viability of routes. Airports reported that airlines leverage their ability to locate planes in a wide range of locations across Europe to achieve as beneficial a deal as possible with airports.
Historically, the airlines that were most prone to re-allocating capacity have been LCCs. As part of their rapid expansion, LCCs have also ventured beyond small regional airports to medium- and large-sized airports. Unsurprisingly, route-switching rates have increased at these airports, and the rate of route churn is now similar at airports serving 10–25mppa to that experienced at smaller airports. This suggests an increased exposure among medium and large airports to airlines that routinely reallocate capacity across Europe as part of their operations—and can use the threat to do so to amplify their bargaining power with airports.
How has the market for connecting passengers changed?
At some of Europe’s largest airports, a significant proportion of all passengers are not beginning or ending their journey there, but connecting with flights to other destinations. For these passengers, the rapid expansion of airlines such as Emirates, Qatar Airways, Etihad Airways and Turkish Airlines—with their extensive inter-continental networks focused on hubs in the Middle East and Istanbul—means that they are now frequently able to make such journeys between their origin and ultimate destination via a far greater selection of hubs.
Figure 2 below examines the extent to which journeys that can be made by connecting at seven major European airports can also be made via these non-traditional hubs. The figure provides clear evidence of the increasing prevalence of hub options through the Middle East and Turkey. For instance, whereas such an option existed on only 23% of flights connecting via Frankfurt in 2010, the corresponding figure in 2016 was 39%.
Figure 2 Proportion of connecting routes (excluding intra-Europe) at selected European airports competed by Middle Eastern airports and Istanbul, 2010 vs 2016
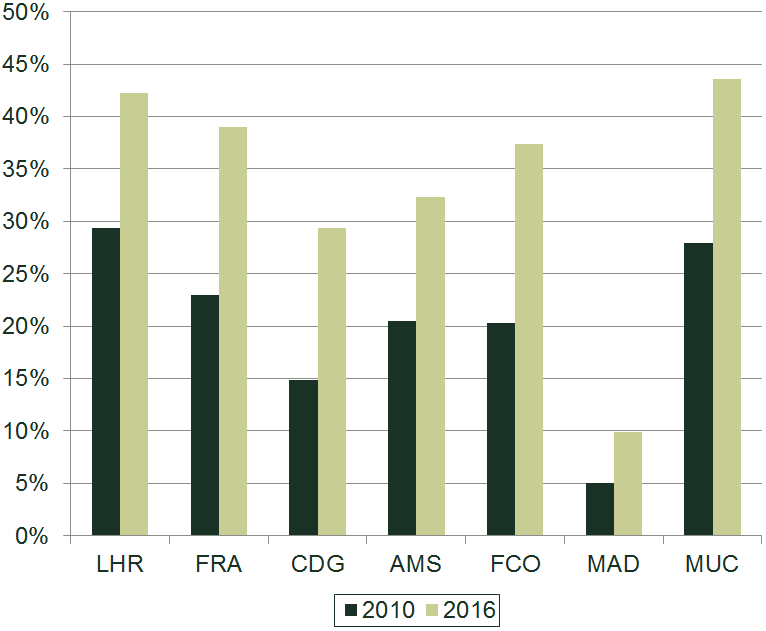
Source: Oxera analysis of OAG data.
In addition to increasingly being able to make a connecting journey via the Middle East or Istanbul, passengers are now more frequently able to avoid the need to change flights altogether. For instance, of 2,295 intra-EU routes where no direct flight was available in 2010 but where a connection was possible via Frankfurt, 343 were possible via a direct flight by 2016. While passengers would previously have had to change flights at Frankfurt or Heathrow in order to travel between Manchester and Vienna, such passengers can now use a direct Jet2 service between the two cities. In addition, both LCCs and airports are beginning to allow passengers to make connecting flights without the need to use a traditional full-service airline alliance.
These developments reflect an increasing level of competition for connecting passengers in Europe.
Competition for passengers in the local area
A third main channel through which airports compete is for passengers travelling to and from the local area. It is this form of competition that has historically been used to assess the market power of individual airports.
The continued growth of the aviation sector means that nearby airports are now more likely to offer services to the same destination as each other, increasing the absolute number of routes for which passengers will be able to choose between two or more adjacent airports. Overall, our analysis suggests that the share of capacity to or from a European airport where it is also possible to reach the same destination from a nearby airport has increased in recent years. This increase is driven primarily by the larger airports, as shown in Figure 3 below. For instance, in 2010 there was an airport within 100km offering a route to the same destination on approximately 24% of capacity from airports in the 25–40mppa bracket. By 2016, this figure had risen to 30%.
Figure 3 Proportion of capacity on routes with competitors by airport size (mppa), 2010 vs 2016
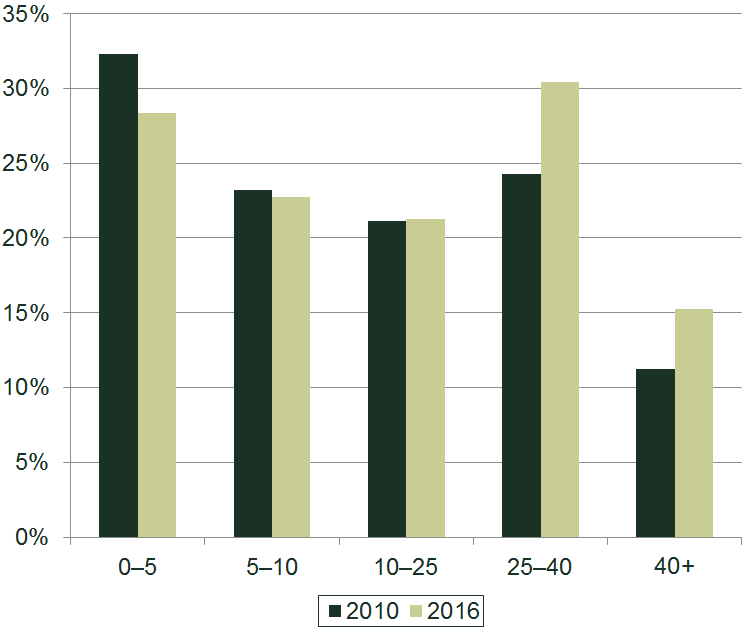
Source: Oxera analysis of OAG data.
Outcomes and implications
Drawing together all of the above, two points become clear. First, the aviation industry has continued to expand in recent years, with this growth layered on top of an undercurrent of continued change within the sector, which includes the success of LCCs and the relative decline of more traditional airlines. Second, these changes have contributed towards an ever-changing landscape in which airports compete.
In our study for ACI EUROPE, we explored a number of the changes to this landscape across three specific channels through which airports compete. First, we found that the ability of airlines to operate routes between alternative destinations—thereby shifting traffic away from particular airports—increasingly acted as a credible threat to (and competitive constraint on) medium and larger airports. In this respect, medium and larger airports find themselves facing an environment that is more similar to that faced by small, regional airports.
Second, the rapid expansion of super connector airlines has resulted in transfer passengers increasingly having the option to make a journey via a hub in the Middle East or Turkey, when they would have once needed to make it via a large European hub. Combined with the growth of point-to-point traffic—which can make changing flights unnecessary altogether on particular routes—this suggests that the largest traditional European hub airports are facing ever more competition for connecting passengers.
Finally, we observe that competition for passengers within the vicinity of an airport—as measured by the frequency with which passengers have another nearby airport offering flights to the same destination—has increased most rapidly at large airports, more than offsetting a slight reduction in the extent of this competition at smaller airports.
Altogether, this evidence suggests that the degree of competition faced by airports has increased most sharply at medium and larger airports—in particular, as LCC models have become ever more prominent within the industry, these airports are now more likely to face the competitive pressure already experienced by their smaller rivals. This points towards a ‘new normal’ in terms of how competition among airports should be viewed by stakeholders within the industry.
This article is based on Oxera (2017), ‘The continuing development of airport competition in Europe’, prepared for ACI EUROPE, 15 September.
1 In this article, we use ‘Europe’ to refer to the 45 nations that contain at least one airport that is a member of ACI EUROPE (the European trade body for airports), consistent with Oxera (2017), ‘The continuing development of airport competition in Europe’, prepared for ACI EUROPE, 15 September.
2 See Oxera (2017), ‘The continuing development of airport competition in Europe’, prepared for ACI EUROPE, 15 September, section 3.1.
Download

Related

Ofgem’s RIIO-ED3 SSMD: what next for GB electricity distribution networks
On 21 May 2026, Ofgem published its Sector Specific Methodology Decision (SSMD)1 for the forthcoming RIIO-ED3 (ED3) price control for GB electricity distribution network operators (DNOs). We explore some of the key themes in the Decision, ahead of the upcoming business planning period and the expected publication… Read More

PR24 redetermination: what the CMA’s decision means for UK households and water regulation
In this special edition of Top of the Agenda, we’re diving into the UK water sector to explore the Competition and Markets Authority’s (CMA) final determinations: the PR 24 Redetermination process. In England and Wales, the amount consumers pay for their water is regulated by the Office of… Read More