
What’s the data on equity trading market data? Taking stock of the debate
There has recently been intense debate about the costs of equity trading market data. Following a consultation and Review Report by the European Securities and Markets Authority (ESMA) on market data in December 2019, we take stock of the debate and clarify the issues raised. We also check the main facts and explain how to assess market data from a public policy perspective.
This article draws on the analysis set out in Oxera (2019), ‘The design of equity trading markets in Europe: An economic analysis of price formation and market data services’, prepared for Federation of European Securities Exchanges, March (hereafter, ‘our report’). For ESMA’s consultation and Review Report, see European Securities and Markets Authority (2019), ‘Consultation Paper: MiFID II/MiFIR review report on the development in prices for pre- and post-trade data and on the consolidated tape for equity instruments’, ESMA70-156-1065, 12 July; and European Securities and Markets Authority (2019), ‘MiFID II/MiFIR Review Report No. 1: On the development in prices for pre- and post-trade data and on the consolidated tape for equity instruments’, 5 December.
To understand the debate on market data, we first need to look at trade execution services. In 2007, the Markets in Financial Instruments Directive 2004/39/EC (MiFID I, later updated as MiFID II and its accompanying regulation, MiFIR) introduced competition in the market for equity trading services. Today, when a broker or investor wants to execute a trade order, it can choose from a range of venues such as stock exchanges, multilateral trading facilities (MTFs),1 dark pools,2 and systematic internalisers (SIs).3 The introduction of competition resulted in more choice and reductions in trading fees over time.4
The role of price formation (the process by which information is incorporated into prices) in the design of equity trading markets is well documented in the literature, but is sometimes overlooked in the debate on market data. As an information-gathering process, price formation ensures that market participants are sufficiently informed about the prices of the assets being traded such that they can make informed commercial decisions.
A well-functioning price formation process delivers more efficient and fairer markets and lowers the costs of capital for businesses (see the box below).
Benefits of price formation
Accurate prices from stock exchanges lead to benefits, including:
- more efficient markets—prices more closely reflect all the available information;
- fairer markets—participants can be confident that trades are executed close to fundamental prices and that the market is free from manipulation;
- lower costs of capital for businesses—both directly and through a reduced illiquidity premium;
- new business models—other participants can offer trade execution services using the price formation provided by stock exchanges;
- improved asset valuation—accurate stock prices are used for the pricing of many derivatives, structured products, indices and non-traded assets.
The ultimate beneficiaries are the investors, fund managers and other users that take decisions based on those prices.
Stock exchanges deliver both trade execution and price formation, through a range of activities (see Figure 1 and the box below).
Figure 1 Activities contributing to price formation
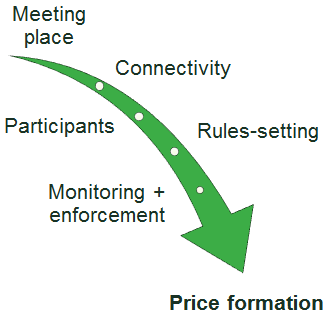
Exchange activities contributing to trading and price formation
- Ensuring that market participants have a meeting place where they can signal their intention to trade—nowadays this is mainly done virtually and involves investing in capacity and maintenance of matching engines, and proactively responding to new threats from cyberattacks, fraud and operational risks, for example. To deliver continuity of service, exchanges invest in hardware and software that can cope with significant over-capacity at all times.
- Ensuring connectivity, in the good times and the bad—this means investing in networks (e.g. fibre-optic lines, microwave towers) to provide users with fast access and reliable connectivity. These costs can be incurred by stock exchanges, third parties, or market participants directly.
- Attracting the right mix of investors to trade—some exchanges provide liquidity programmes to ensure liquidity provision on both sides of the order books during normal and volatile market periods.
- Setting fair and consistent rules—rules-setting facilitates predictability in the price formation process, constrains fraudulent and manipulative activity, and aims to reduce trading costs.
- Conducting market surveillance and enforcement of the trading rules to ensure that the trading intentions being submitted to the order book are reliable and contribute to the price formation process, rather than undermining it.
Many of the new types of trading venue, such as dark pools and SIs, do not deliver their own price formation process.5 These venues can offer trade execution using the price formation delivered by stock exchanges and other regulated markets. Stock exchanges make this available to them via the licensing of market data, which includes pre- and post-trade information on quotes, orders, execution prices and respective volumes.6 Platforms such as dark pools then use this information to execute trades at the mid-price, while SIs can use it to inform the setting of their own prices, ensuring that these make sense from a commercial perspective and are attractive to their clients.
Due to this important piece of ‘market design’, these alternative venues do not need to invest in the systems and human resources required to deliver robust price formation processes themselves, thereby saving costs.
Market data is also used by fund management and brokerage firms to inform their trading and execution strategies. Other users of market data include index providers, retail investors, regulators and researchers.
The amount and type of data consumed varies from user to user—some demand low-latency, full order book data, while others use delayed or historical data. For example, high-frequency traders (HFTs) tend to seek real-time data feeds and co-location services, while some fund managers and brokers may use more limited datasets.
Why do stock exchanges charge for market data?
Data that is more than 15 minutes old is made available free of charge to end-users by stock exchanges. This means that retail investors who want to know what their portfolio is worth, fund managers who need to value their funds at the end of the day, and many other professionals who use share prices for financial or economic analysis can receive high-quality market data from exchanges without paying any exchange fees.
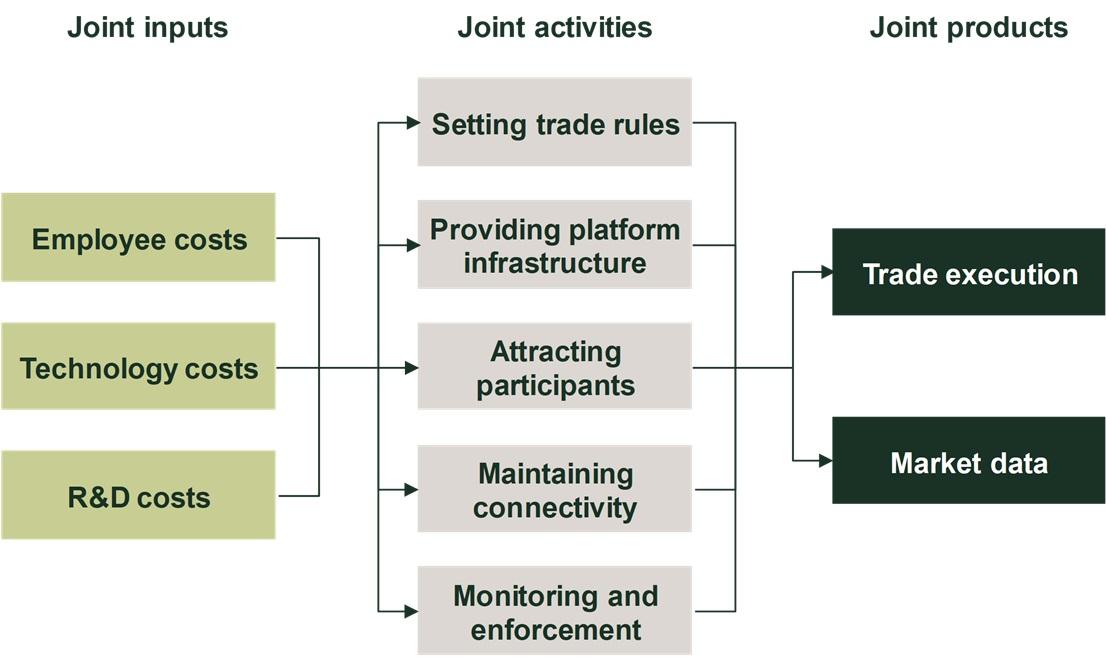
So, why do stock exchanges charge for real-time data? There are costs to delivering a high-quality price formation process, and, as also mentioned by ESMA, trade execution and price formation are ‘joint products’ (see Figure 2): most activities undertaken by a stock exchange are integral to the delivery of both. This means that it is more efficient to recover some of the costs of operating a trading venue through trade execution fees and some through market data fees. It also means that a broader group of market participants (i.e. including those that do not trade but do benefit from the price formation process, such as SIs and dark pools) contribute to covering some of the costs of price formation.
Figure 2 Joint products
Has there been a significant increase in the fees charged by stock exchanges for market data and their associated revenues?
There has been much debate about whether market data fees have increased over time, prompted by two points of confusion.
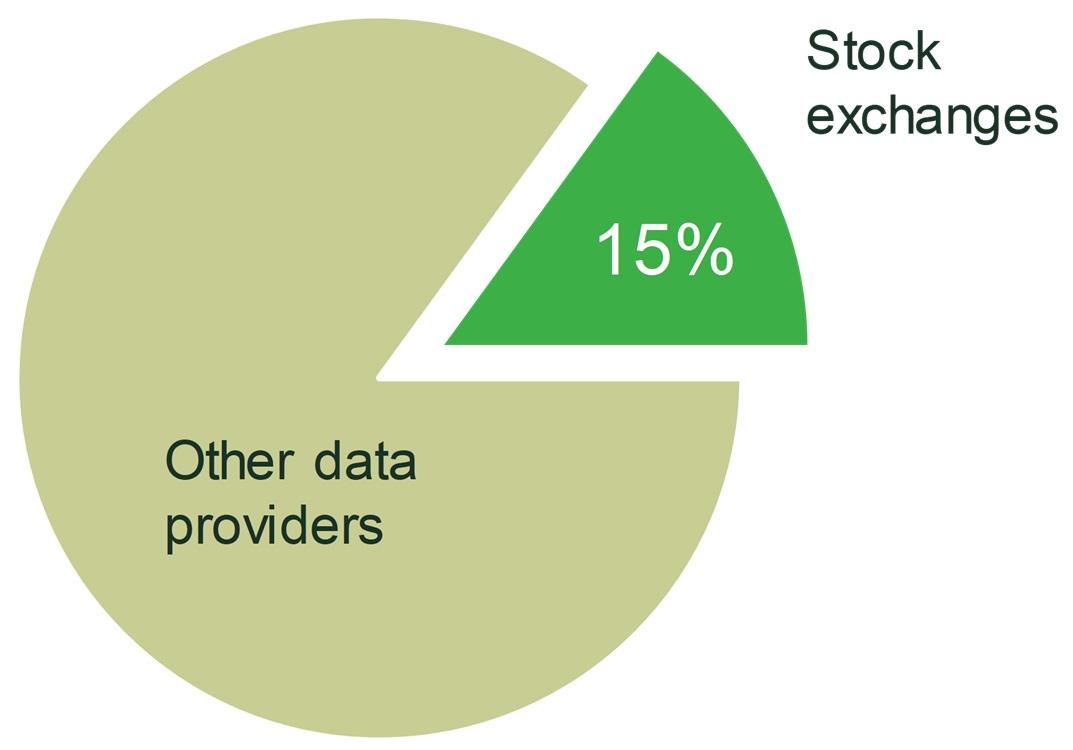
First, the fact that stock exchanges’ market data revenue is a small proportion of the total spending on market data is often overlooked. Stock exchange market data is only a small part of the market data used by market participants, which also includes news, alternative data, research, ratings, valuation data, reference data, and so on (see Figure 3). Some of the claims about significant increases in market data fees or expenditure refer to the rise in general spending on market data, rather than expenditure on stock exchanges’ market data fees. Market data revenues from stock exchanges account for around 15% of the total value chain (see Figure 4).7
Figure 3 Types of market data services
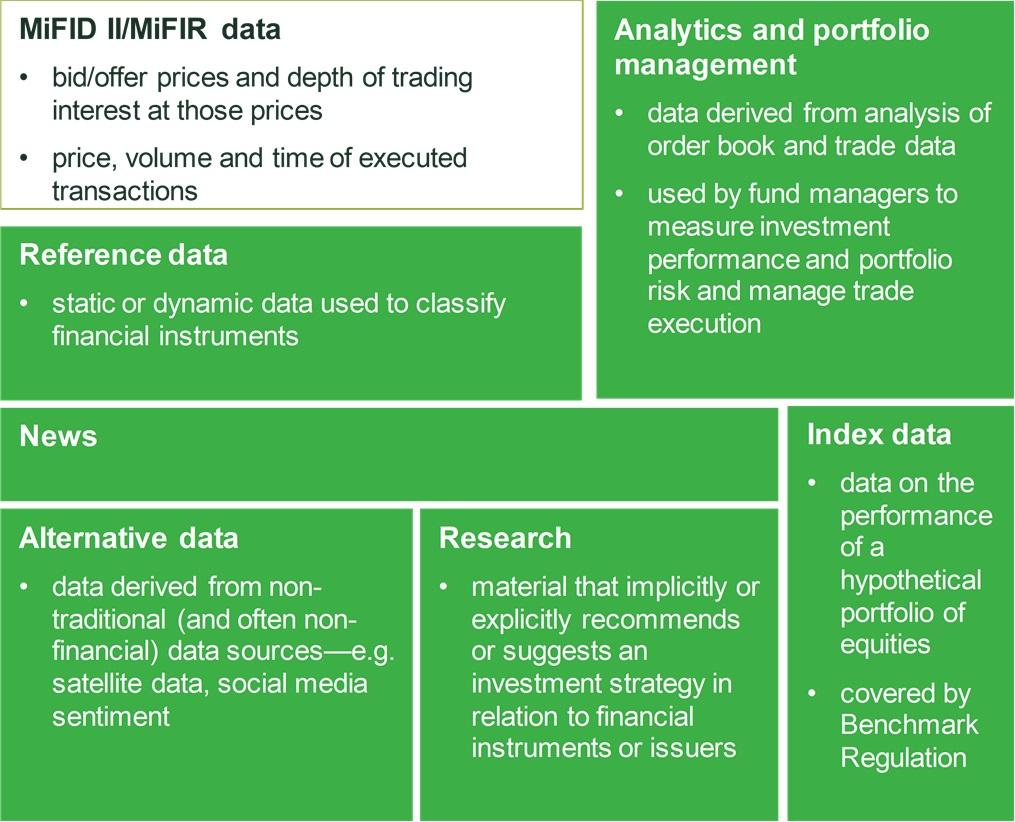
Figure 4 Market data revenues, 2018
Second, what individual market participants and trading venues spend on market data (from stock exchanges) can vary over time due to changes in prices, the amount of data consumed, and usage patterns. When assessing expenditure on market data, these factors are often confused, as we explain in more detail in the next section.
Changes in price, volume and usage patterns
When assessing changes in expenditure on market data, it is important to understand whether these are driven by changes in prices, the amount of data consumed, or usage patterns.
Price changes—changes in the price of a given data product
- Exchanges have made changes to their fee schedules over time. The Oxera analysis showed that, for most exchanges, market data fee increases have been small. For example, in real terms, in the case of most exchanges, for Level 1 and Level 2 display data fees generally increased less than 1.5% per year, and for non-display by less than 4.5% per year.8 However, there is some variation across financial centres—for example, one of the smaller exchanges increased non-display fees between 2012 and 2018 by approximately 115%.9 The context is relevant here—this percentage increase is high since it was applied to a relatively low base fee in 2012, and the 2018 fee is below the average non‑display fee observed across stock exchanges in 2018.
Volume changes—changes in the total number of data products consumed
- It is well understood that there has been an upward trend in market data consumption. This has been driven by a rise in trading strategies that require more data (in particular due to the significant growth in electronic trading), and an increase in data used to inform commercial decisions and regulatory assessments.
Usage patterns—changes in the type of data product consumed per user
- Changes in usage patterns refer to users changing the type of data package. For example, partly as a result of the growth of high-frequency and algorithmic trading, there has been a shift of market data consumption away from terminals and towards direct and low-latency (non-display) data products for automated applications.
Some of the analyses submitted by market participants in response to the ESMA consultation indicate that expenditure on non-display fees has increased significantly.10 This is indeed what one would have expected to observe, and confirms the general trend in the market of a shift away from display data and towards non-display data. Importantly, the non-display market data fees are typically charged per firm rather than per person, and switching away from display to non-display data products can therefore also be more cost-efficient.
Aggregate expenditure on market data has been fairly stable
To truly understand the overall changes in the expenditure on stock exchanges’ market data, it is best to look at the total revenues that the exchanges generate from the MiFID II/MiFIR market data. These revenues give us the complete picture of what all users together (e.g. fund managers, brokers, MTFs, SIs, dark pools and retail investors) spend on cash equity market data from exchanges. They capture the combined effect of changes in prices, the amount of data consumed, and usage patterns for all users.
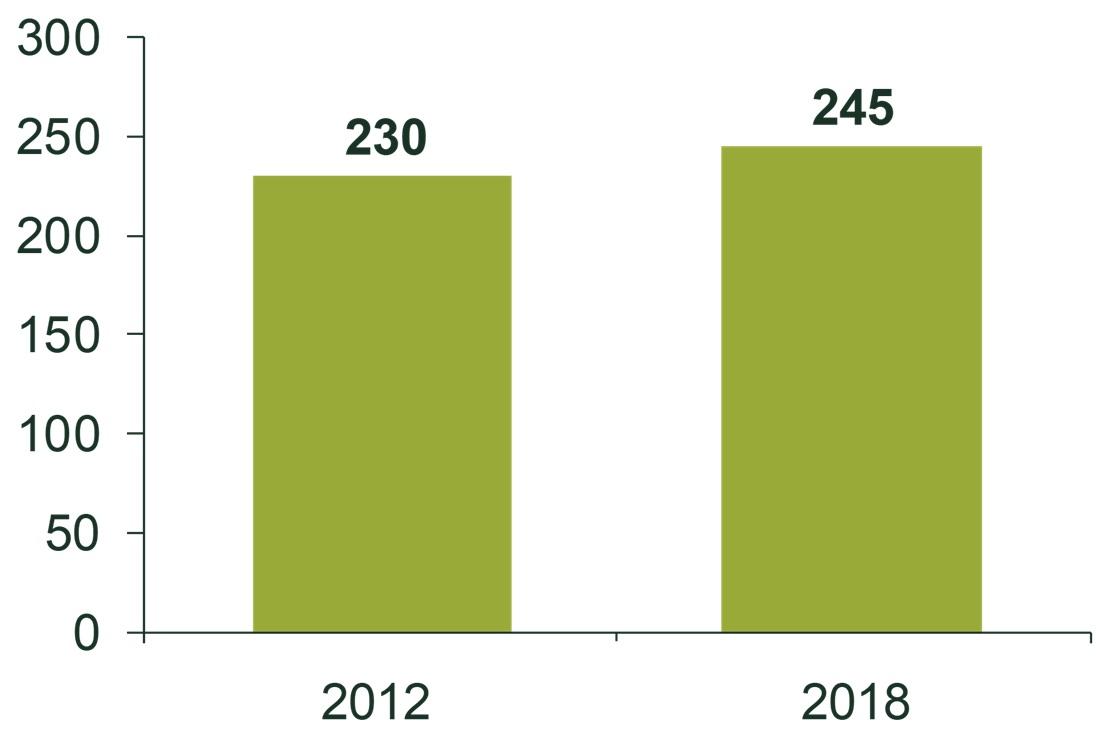
The Oxera analysis shows that, despite increases in data consumption, revenues from stock exchanges have remained fairly stable. Overall, aggregate revenues (of stock exchanges that are members of the Federation of European Securities Exchanges, FESE) amounted to €245m in 2018, and have increased by around only 1% per year in real terms. There is some variation across exchanges—for some, market data revenues fell over the period, while for others revenues increased. ESMA presented a similar analysis in its Review Report and also found that overall revenues of trading venues from selling market data have been stable, with a slight increase over the period 2015–18.
Figure 5 MiFID II/MiFIR market data revenues from FESE exchanges, 2012–18 (€m)
How to assess market data fees?
Although market data expenditure overall has remained fairly stable, some market participants have argued that the current level of fees is not reasonable. In its consultation paper, ESMA summarises this as follows:
While it appears that the price of market data may not have increased overall, there are some indications that in areas and for use cases where there is high demand for market data, fees have increased.11
In other words, although the price (i.e. stock exchanges’ market data revenues) may not have increased overall, it might have done in some specific areas.
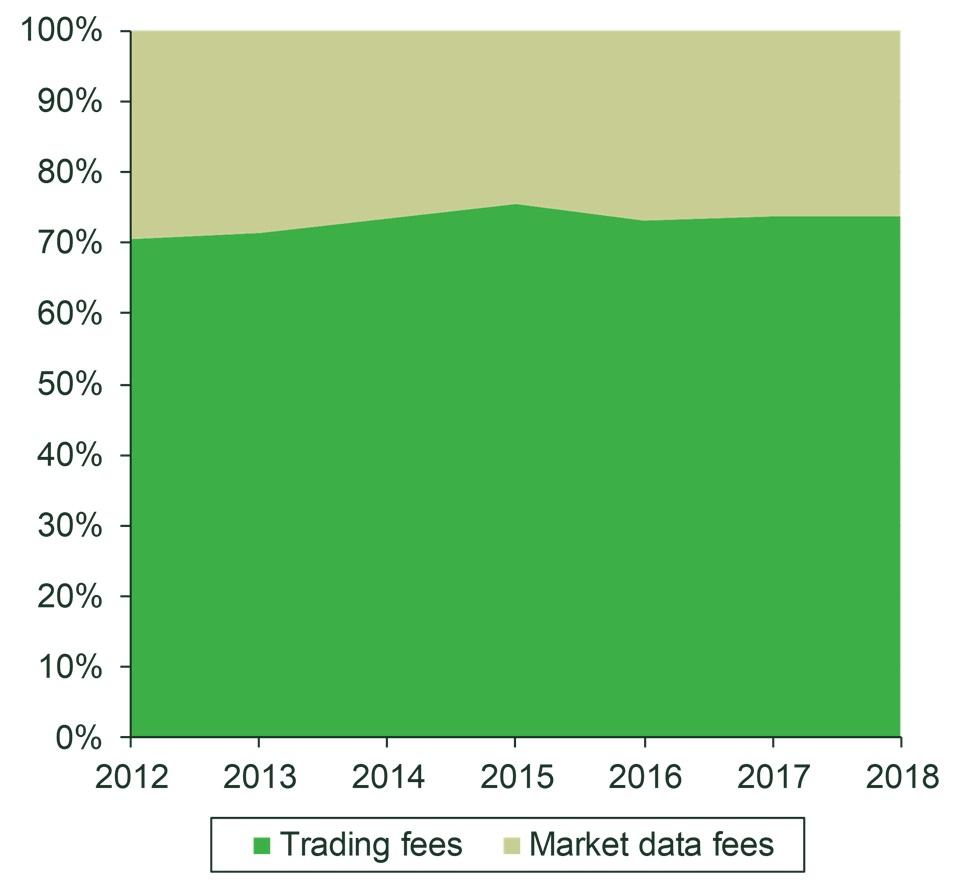
From a public policy perspective, the question is whether market data fees result in a distortion in market functioning (for example, in terms of efficiency and/or competition), or more generally in poor outcomes for the end-users of equity trading markets. Would having some types of user contributing substantially to exchanges’ market data revenues, and perhaps more so than others (due to higher fees and/or consumption of more data), be a concern from a public policy perspective? We analyse these questions within an economics framework in the Oxera report, and find no detrimental effects on market outcomes for end-users. In fact, recovering some costs through market data fees (on average, 30% of the joint product revenues come from market data fees) is efficient from an economics perspective.
The impact of market data fees on market functioning and end-investors can be assessed by, for example, examining their impact on efficiency and competition.
Impact on market efficiency—the concern would be that charging for market data would reduce the amount of data consumed and ultimately have a negative impact on price formation. There is some academic literature on the impact on wider market efficiency.12 These theoretical contributions suggest that, under certain, very specific, conditions (e.g. no competition in equity trading), charging for market data could impair price formation, but that, as competition for equity trading is present, the stock exchange has an incentive to maximise order flow, which in turn prevents it from setting market data fees at a level that would negatively affect the price formation process.
In practice, the share of revenues coming from market data services ranges from 20% to 50% of joint (trade execution and market data) revenues across exchanges. This suggests that the optimal balance between trade execution and market data revenues may vary by exchange.
Figure 6 Revenue shares from delivering equity trading and price formation, 2012–18 (weighted average of FESE exchanges)
Impact on competition—for example, in theory, if market data fees were very high, this could affect the viability of new trading venues that do not have their own price formation process and use market data from stock exchanges as an input. However, the significant growth in dark trading, SIs and new entrant trading venues suggests that their business models are not being undermined, and that current market data fee levels enable them to operate effectively.
In sum, the economic analysis does not provide evidence that the current charging structures for market data are leading to detrimental market outcomes for investors. Although the responses to the ESMA consultation contained analyses of market data expenditure and fees, there was no evidence of any distortionary impact on market functioning and/or poor outcomes for end-investors.
Concluding remarks
As with many policy issues, a robust economic framework together with an empirical analysis can assist in evaluating whether and what type of regulatory intervention would be required. The debate on market data is no different.
Rather than proposing price regulation (as some market participants had suggested), which is a drastic form of regulatory intervention, ESMA has proposed to provide supervisory guidance to improve the usability and comparability of the information that trading venues are required to disclose on market data fees and costs.
If there were concerns about the market data fees being too high for certain use cases, these cases could be assessed under competition law. Such an evaluation would be informed by an empirical analysis of any distortionary impact of the fees.
1 An MTF is a multilateral trading system, operated by an investment firm or a market operator, that brings together multiple third party buying and selling interests in financial instruments, in the system and in accordance with non-discretionary rules, in a way that results in a contract. These venues operate under a lighter set of rules than traditional stock exchanges and are not generally used for the of listing financial instruments (with the exception of ‘junior markets’).
2 Dark pools are trading venues where there is no pre-trade transparency—i.e. orders submitted to the venue are hidden from other market participants prior to execution of the trade.
3 An SI is defined under MiFID II as an investment firm that, on an organised, frequent systematic and substantial basis, deals on its own account when executing client orders outside a primary stock exchange or an MTF without operating a multilateral system. ESMA is responsible for measuring the threshold for a ‘frequent and systematic basis’.
4 Oxera (2011), ‘Monitoring prices, costs and volumes of trading and post-trading services’, report prepared for European Commission DG Internal Market and Services, May.
5 There is some evidence that new-entrant ‘lit’ venues contribute to price formation. For example, see Ibikunle, G. (2018), ‘Trading places: Price leadership and the competition for order flow’, Journal of Empirical Finance, 49, pp. 178–200.
6 Market trading data offered by exchanges, on a fair and non-discriminatory basis, includes: Level 1 data—best bid and offer prices, and executed trades, with respective volumes; Level 2 data—Level 1 plus typically the five best bids and offers from the order book; and full order book data—Level 2 plus all individual orders on the book.
7 See section 4.5.2 of our report.
8 See section 4.8 of our report.
9 See section 4.8 of our report.
10 See European Securities and Markets Authority (2019), ‘Consultation paper: MiFID II/MiFIR review report on the development in prices for pre- and post-trade data and on the consolidated tape for equity instruments’, ESMA70-156-1065, 12 July.
11 European Securities and Markets Authority (2019), op. cit., para. 32. According to ESMA, ‘Moreover, it seems that currently market data prices are not only charged on the basis of the costs for producing and disseminating market data but also reflect the value of the data for data users.’ It is indeed likely that market data fees are based on the costs of producing and disseminating market data, but also that they reflect the value of the data for data users. Exchanges are likely to allocate the fixed costs on the basis of the value that users may derive from the data. Thus, users who value the data more will also contribute more to the recovery of the fixed costs, which is efficient from an economics perspective.
12 See section 5.4.2 of our report.
Download

Related

No water, no growth: tackling inefficient business water demand
Water is not typically thought of as a constraint on economic growth in England. Yet that is precisely what it is becoming. Commercial growth and new developments are being turned away because there is insufficient water to serve them. Some water companies are already exercising their powers to refuse… Read More

The energy trilemma in focus: the price of dependence
Europe’s approach to energy policy has been in transition since the 2022 energy crisis laid bare the continent’s dependence on imported fossil fuels. More recently, the outbreak of war in the Middle East and the subsequent disruption to global oil and gas markets have caused further challenges. This article… Read More