
The Big McBroadband index: a recipe for more meaningful cross-country price comparisons
Price benchmarking exercises are an often used tool by policymakers. When comparing prices across countries, common practice is to make purchasing power parity (PPP) adjustments to control for differences in local price levels and the cost of living (e.g. wages, rent, and taxation). This helps shift the focus from simple absolute price and currency differences to affordability. The Big Mac Index, for instance, offers a simple, informal measure of PPP by comparing the price of a standardised product across countries worldwide. But can such simplicity offer meaningful insights when comparing more complex goods or services such as consumer broadband? We argue it cannot, and propose a more nuanced approach to assessing cross-country price comparisons.
The Big Mac Index
In 1986, The Economist newspaper created The Big Mac Index as an informal way of measuring the purchasing power parity (PPP) between two currencies. PPP is the economic theory that, in the long term, exchange rates between two currencies should adjust so that a basket of goods costs the same in both countries when priced in a common currency.
The intuition behind the Big Mac Index is that, because the ingredients and production process of a Big Mac are standardised, it should cost roughly the same to produce and sell one anywhere in the world. Therefore, if PPP held perfectly, the price of a Big Mac, when expressed in a common currency, would be roughly the same across countries. Significant price differences may indicate that exchange rates are misaligned or that the Big Mac is relatively more expensive or cheaper in one country due to local factors.
While this is a simple example, when comparing prices of goods across countries, PPP adjustments are often made to control for differences in local price levels and the cost of living (e.g. local wages, rent, taxation, etc.), so that comparisons reflect true purchasing power rather than just absolute price or currency differences, allowing for comparisons of real value or affordability between countries.
However, can adjustments for PPP alone provide meaningful insights when comparing more complex goods and services such as consumer broadband?
The Big McBroadband index?
The pricing of retail telecommunications services can provide insight into how effectively markets are delivering for consumers. Cross-country comparisons of broadband price levels can therefore offer valuable evidence to inform regulatory and policy decisions in the telecommunications sector.
Organisations such as the European Commission, the OECD and the International Telecommunication Union have conducted studies to benchmark fixed broadband prices internationally.1 These studies typically adjust prices for PPP and control for a limited set of product characteristics using a ‘basket approach’. However, this method has important limitations.
First, the basket approach only partially controls for product differences—often relying on a single tariff per basket. This does not ensure like-for-like comparisons across countries, as the underlying service features can vary significantly.
Second, PPP adjustments alone do not account for the full range of cost drivers and market dynamics that influence broadband pricing.
In reality, a much broader range of factors affects the cost of providing broadband services, and hence retail prices. Without controlling for these additional variables, international price comparisons can be misleading.
Would you like fibre with that?
Consider the following, simple example. Suppose country A is providing a broadband service to customers over a legacy copper network with speeds of up to 24 Mbit/s, whereas country B is providing a broadband service to customers over a gigabit-capable, newly deployed fibre-to-the-home network. Finding that the typical price for a broadband service in country B is greater than in country A—even after adjusting for PPP—does not necessarily mean that country B’s pricing is excessive, unfair, or providing poor value for money for consumers. The underlying network quality and technology differ and this could justify the price difference.
Now take country C, that also offers a broadband service to customers over a gigabit-capable, newly deployed fibre-to-the-home network. However, the topology of the country is such that the population density is much lower, due to fewer urban centres and a larger, more widely dispersed, rural population. Again, a finding that broadband in country C is more expensive than in country B may reflect the greater cost of infrastructure deployment—not overpricing.
To meaningfully compare broadband price levels across countries, these differences must be accounted for.
This raises the question, what if we could estimate the price of broadband in each country as if it were offered by a hypothetical pan-European broadband provider? In other words, what would the price be for a product with specific features (supply factors) and given certain country characteristics (network factors, competition, and regulation), based on pricing practices observed across a broad sample of tariffs provided by many different operators in many different countries?
A recipe for fairer comparisons
One option to better account for the full range of factors that influence price differences across countries would be to apply econometric modelling to empirically assess the relationship between retail broadband prices and the factors that drive them. This would allow us to move beyond simplistic comparisons and towards a more meaningful, data-driven understanding of cross-country pricing differences.
For example, we could examine how broadband list prices (across a wide sample of tariffs and countries) are influenced by the following three key groups of explanatory variables.
- Supply factors—these represent the technical and commercial features of the broadband service itself, such as the underlying technology, advertised download speed, data caps, and whether the service is bundled with others.
- Network factors—these reflect country-specific characteristics that impact the cost of network deployment, including technology coverage, urban/rural population split, and GDP per capita, as well as information around digging costs if available.
- Competition and regulation factors—these could include market dynamics such as the degree of competition (e.g. market concentration) and the presence of state aid or other regulatory interventions.
By quantifying the impact of these factors on broadband prices, we can better understand what drives price variation across countries. This, in turn, enables more meaningful comparisons of affordability and value, as it accounts for differences in underlying conditions rather than simply highlighting price differences that may be driven by context.
Regress for progress
The first step towards this goal, is to understand how retail broadband prices relate to the factors influencing them. One effective method is regression analysis, which empirically examines these relationships using a large data sample. This approach identifies the key drivers of retail broadband pricing and estimates their relative importance.
In this regression model, retail broadband price would be the dependent variable—the outcome we want to explain. We would then include a carefully selected set of explanatory variables that capture the factors driving variation in retail prices across countries.
Once these relationships are established, the model could estimate predicted prices in each country, as if the broadband service were offered by a hypothetical pan-European provider. That is, what would the price be for a product with specific features, given particular country characteristics and observed pricing practices across European member states?
To calculate predicted prices, we would multiply the coefficients from the regression by the corresponding values of each explanatory variable for each tariff, country, and time period. This produces the expected prices based on the modelled relationship between prices and their key determinants.
After estimating predicted prices, we could compare them to the actual prices charged by calculating the percentage difference.
- A negative difference means that the actual prices are below the predicted prices, suggesting that the country’s broadband prices are cheaper than expected given the key determinants.
- A positive difference indicates that the actual prices are higher than predicted, suggesting more expensive broadband relative to what the model anticipates.
This approach would, therefore, provide a more nuanced and empirically grounded way to assess and compare broadband prices in one country to others across Europe—far beyond simple comparisons of PPP adjusted prices—by accounting for the many factors shaping prices in each market.
Practice what you preach
In a recent research exercise for KPN in the Netherlands we conducted exactly this exercise for a sample of European countries, relying on data that is available in the public domain from a reputable source, and which is consistently and reliably reported across countries and time.
We relied on three main sources of data to populate the model: (i) proprietary data supplied by Point Topic; (ii) data from Eurostat; and (iii) data from the European Commission.
Ingredients for the model
We focused the scope of our model across the time, product and country dimensions. Specifically, our regression model:
- analysed prices across the period 2019–23, including five full years of data, which provided a sufficient number of observations to ensure that the results were robust and reliable;2
- incorporated all tariffs that feature a fixed broadband service, including all fixed broadband technologies and services sold on a standalone basis or as part of a bundled package with other telecommunications services;3
- analysed prices in ten European countries that, collectively, capture most of the largest broadband markets in Europe, for which we had a comprehensive dataset.
Across our sample, we had a total of 4,399 tariffs.
We undertook a regression analysis including the following explanatory variables.
- Supply factors: broadband technology, download speed, additional services included in bundle, and data cap.
- Network factors: network coverage by technology, population share by area (urban, sub-urban and rural), and GDP per capita.
- Competition and regulation factors: presence of state aid and a measure of market concentration.
Due to data limitations, we could not include a comprehensive set of factors that may have been relevant in determining the levels of retail broadband prices.4 However, the explanatory variables we did include produced a robust model that explains much of the variation in prices across countries, and is therefore valuable in controlling for key factors across countries and generating more meaningful comparisons.
What the data dishes up
Through this exercise, we were able to assess for each country how observed prices perform relative to the modelled relationship between prices and the key determinants of price across the full sample.
Naturally, we found that some countries have lower actual prices compared to the model’s predictions—suggesting that operators in that country are, on average, pricing lower than the level suggested by the model—and are therefore considered to perform better than those countries where actual prices are higher compared to those predicted by the model.
For example, the figure below, gives an indication of the findings for the Netherlands. The chart illustrates that, on average, actual prices in the Netherlands, even adjusted for PPP, are 11% below the level that is predicted by our model.
Figure 1 The actual and predicted prices of broadband tariffs in the Netherlands (2019–23)
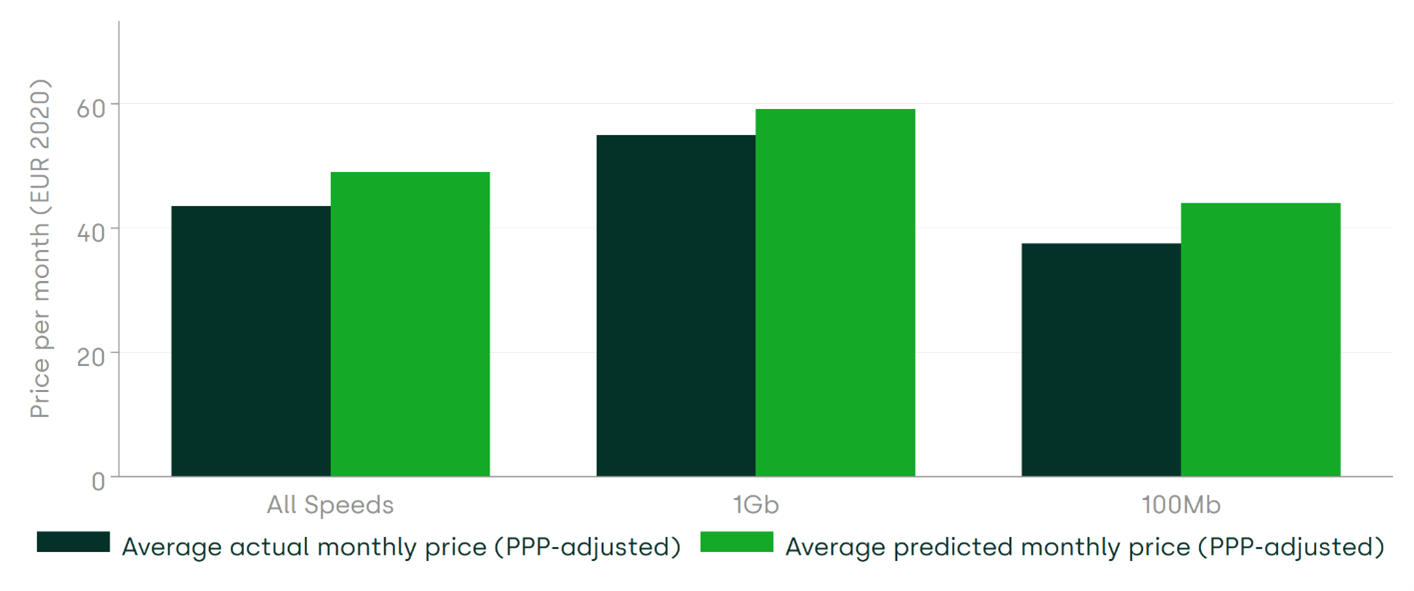
This shows that, for example, the Netherlands compare more favourably in relative terms, once the relevant factors that affect prices (such as important differences in network technology, geography or market conditions) have been properly accounted for.
This highlights the importance of accounting for these relevant factors if meaningful and robust comparisons of pricing practices across countries are to be made.
Conclusion: towards smarter price benchmarks
For complex goods and services, such as consumer broadband, adjustments for PPP alone cannot provide meaningful insights for cross-country price comparisons.
Given that there is a much broader range of factors influencing the differences in costs of provision and pricing dynamics across countries, there are significant limitations to making meaningful price comparisons across countries without controlling for a more complete set of explanatory variables. In order to make meaningful comparisons, it is important to understand and account for differences in these factors between countries and their role in explaining why prices may differ.
We have offered a more robust approach to price comparisons, through empirical methods, that could be used to shed more light on value or affordability between countries.
Policymakers should consider using methods such as this before jumping to conclusions that observing higher absolute or even PPP adjusted prices in some countries automatically suggests that consumers are getting a bad deal.
Footnotes
1 European Commission (2024), ‘Mobile and Fixed Broadband Prices in Europe 2022’, 22 April; International Telecommunication Union (2024), ‘Policy Brief: The affordability of ICT services 2023’, March; OECD (2020), ‘OECD bundled communication price baskets’, OECD Digital Economy Papers, December, No. 300.
2 We did not include 2024 as the data for the network factors was not available in the public domain from a reputable source and/or consistently and reliably reported at the time.
3 We included all fixed broadband technologies (DSL, VDSL, FTTP and Cable).
4 For instance, we were unable to include an explanatory variable that directly controls for differences in the average of deploying network infrastructure between countries—for example, through a consistently reported metric of CAPEX per home passed, which would take into account factors such as different costs of digging or costs of deploying different network topologies. However, we specified our model to control for underlying factors that would, in part, determine differences in the average cost of deploying network infrastructure between countries. Indeed, our model, at least partially, controlled for differences in network deployment costs between countries with the following ‘network factors’. We accounted for differences in the population share by area type (urban, sub-urban and rural). As this factor will affect network deployment costs, through economies of density, this variable will indirectly capture some of the variation in prices driven by differences in network deployment costs between countries. We accounted for differences in GDP per capita. This factor will affect the cost of labour, which in turn will affect the unit costs of network deployment. Therefore, this variable will indirectly capture some of the impact driven by differences in network deployment costs between countries.

Related

No water, no growth: tackling inefficient business water demand
Water is not typically thought of as a constraint on economic growth in England. Yet that is precisely what it is becoming. Commercial growth and new developments are being turned away because there is insufficient water to serve them. Some water companies are already exercising their powers to refuse… Read More

The energy trilemma in focus: the price of dependence
Europe’s approach to energy policy has been in transition since the 2022 energy crisis laid bare the continent’s dependence on imported fossil fuels. More recently, the outbreak of war in the Middle East and the subsequent disruption to global oil and gas markets have caused further challenges. This article… Read More