
Who doesn’t invest and why? A behavioural data science perspective
As we adjust to a high inflation environment, those who are fortunate enough to have savings are seeing their purchasing power erode by up to 10% per year. In the UK, one way to mitigate the effects of inflation is through investing in Stocks and Shares ISAs. But why are some people more likely to invest than others? We explored this question using behavioural data science.
There is evidence of underinvestment by UK consumers. The UK Financial Conduct Authority (FCA) notes in its latest Financial Lives Survey that nearly 8.6m consumers around the UK each hold £10,000 or more in investable assets in cash.1 What are the factors that determine why some consumers are more likely to invest than others?
To address this question, we carried out a consumer survey and called on behavioural data science. It appears that investment decisions depend on a number of behavioural preferences, biases and consumer beliefs, which differ according to consumer characteristics. In this article we explore the evidence, and pose some solutions to address the barriers to investment. The box below gives an overview of ISAs.
What are ISAs?
ISAs (individual savings accounts) are a type of retail investment available to consumers in the UK. They have the advantage that no tax is paid on the returns (including interest from cash, and dividends from stocks and shares). There is an annual limit of £20,000 on the amount that one consumer can invest across all of their ISAs.
The two most popular types of ISA are:
- Cash ISAs. These can be used to hold cash savings (only). There is typically a fixed rate of return;
- Stocks and Shares (S&S) ISAs. These can be used to hold different types of investment including stocks and shares, fixed interest investments, and cash. Money held in a S&S ISA can be withdrawn at any point, although this may not always be optimal, as the value of the investments is likely to fluctuate.
Source: Oxera.
Who invests in Stocks and Shares ISAs?
To assess how consumers’ characteristics affect their investment decisions, we collected data on consumers’ demographics, beliefs and behavioural biases through a survey of 2,002 participants, conducted with Accent Market Research from June to July 2022. The sample contained three groups of consumers:
- participants with a S&S ISA;
- participants without a S&S ISA but with a Cash ISA;
- participants with at least £5,000 held in a bank account (but no ISA).
We undertook a statistical ‘regression analysis’ to better understand consumer behaviour. Here, we controlled for factors such as income, job level and age. We found that certain demographic characteristics have a statistically significant effect on investment decisions. In particular, according to our data:
- consumers in the lowest socioeconomic group (SEG) are 18% less likely to invest than people in the highest SEG;
- consumers living in London are 16% more likely to invest than consumers living in Wales;2
- male consumers are 8% more likely to invest than female consumers.
Our findings are in line with literature on the gender investment gap. For example, the FCA’s 2018 Financial Lives Survey finds that 19% of men have a S&S ISA, while only 12% of women do.3
Consumer groups who are less likely to invest are also typically those with lower average earnings and lower investable assets than average, making them more vulnerable to the effects of inflation. Women on average earn 15% less than men.4 Using the mean, the average woman has just 65% of the investable assets of the average man, while the median woman has just 47% of the investable assets of the median man.5
As investing can shield against the effects of inflation, the disparity in investment along gender, regional and socioeconomic lines could exacerbate pre-existing financial inequality.
How do peer effects shape investment decisions?
Our survey also looked into ‘peer effects’. We found that whether a consumer believes that ‘people like them’ are likely to invest in S&S ISAs has a large effect on investment decisions. This finding is in line with the academic literature.6
Strikingly, we found that consumers who believe that ‘people like them’ are ‘very likely’ to invest in a S&S ISA are 40% more likely to invest in a S&S ISA compared with those who gave no answer to this question, while people who believe that ‘people like them’ are ‘very unlikely’ to invest are 26% less likely to do so. This is after other factors such as age, gender and income are controlled for, implying that peer effects are important in their own right.
This is an important result. It implies that beliefs about the types of consumer who currently invest (for instance, male consumers from high socioeconomic groups based in London) may be creating positive feedback loops, further encouraging consumers with these characteristics to invest, while dissuading others from investing. This is likely to further entrench gender and socioeconomic inequalities.
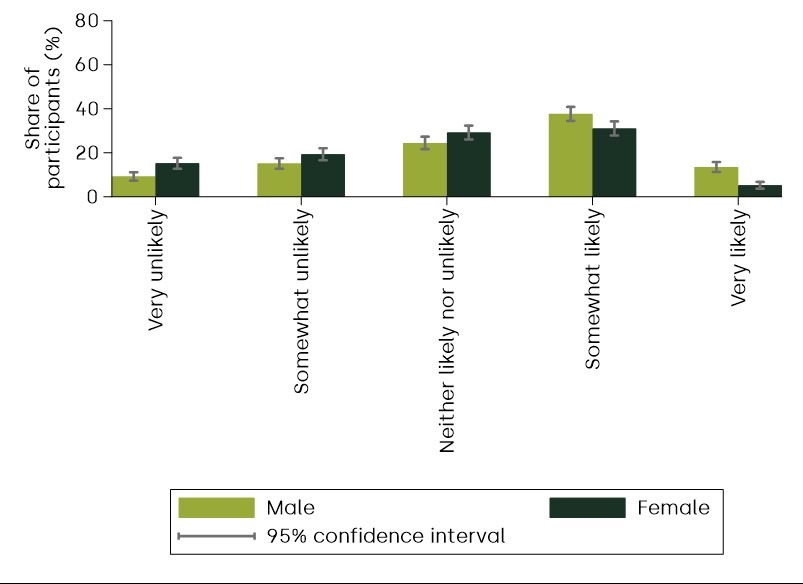
A positive implication is that encouraging consumers to think that ‘people like them’ are likely to invest could make them more likely to invest themselves. For example, as Figure 1 shows, women are less likely than men to think that their peers invest. Establishing female investment as a social norm could trigger more women to think that ‘people like them’ invest, and therefore become more likely to invest themselves. This is known as the ‘bandwagon effect’. One way that this could be utilised going forward is through more inclusive marketing of S&S ISAs.
Figure 1 How likely do you think people like you are to invest in S&S ISAs, by gender?
Source: Oxera.
Risk aversion and loss aversion
Alongside demographics, we found that consumers’ beliefs and biases have an important impact on investment decisions. Most notably, this includes consumers’ risk and loss aversion. These findings are in line with the academic literature.7
Risk aversion, which refers to consumers’ tendency to prefer certainty to uncertainty, has a large and statistically significant impact on investment decisions. According to our regression analysis, a consumer who is highly risk averse is 9% less likely to invest in a S&S ISA than a consumer with low risk aversion, when all other factors are controlled for.8
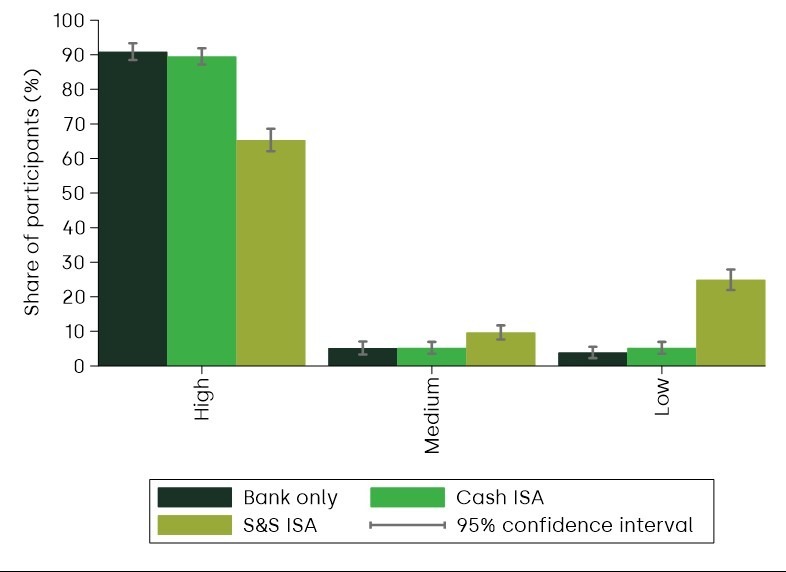
Loss aversion has an even larger impact on consumers’ investment decisions,9 with consumers who are loss averse being 18% less likely to invest in a S&S ISA than consumers who have low loss aversion. Loss aversion refers to consumers’ preference to avoid incurring losses over making equivalently sized gains. As Figure 2 shows, 90% of consumers in the bank account and Cash ISA groups are highly loss averse, compared with 60% in the S&S ISA group.
These effects indicate that fear of losing money is a major reason why consumers are not investing in S&S ISAs. This is backed up by the fact that, in our Cash ISA and bank account only groups, the primary reason given for not investing in a S&S ISA was ‘I didn’t want to put my money in a risky investment’.
Figure 2 Proportion of consumers investing in Stocks and Shares ISAs, by level of loss aversion
Source: Oxera.
Losing money: myth or reality?
If consumers have the correct information about the risk of S&S ISAs, the fact that loss averse consumers are less likely to invest simply indicates that consumers are acting in line with their preferences.
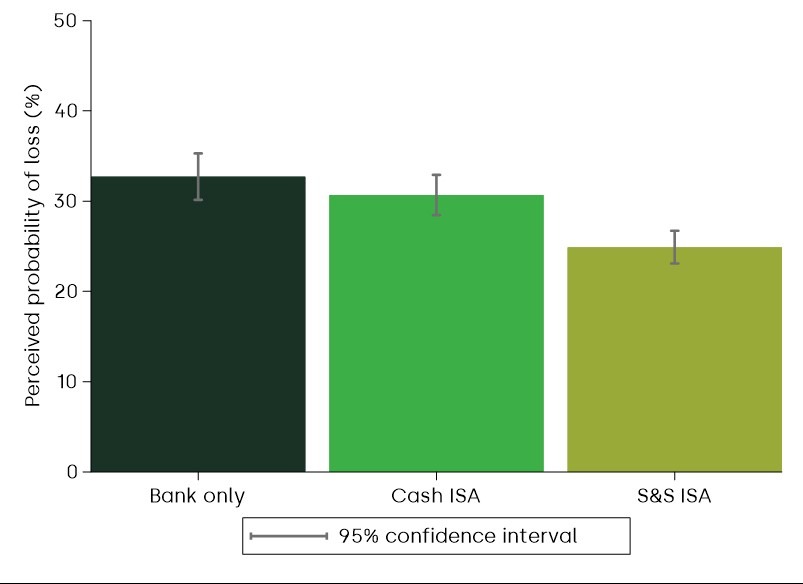
However, our analysis indicates that consumers appear to severely overestimate the probability of losing money in a S&S ISA. The average respondent in our survey estimated the probability of losing money over a ten-year period to be 29%, as shown in Figure 3. By contrast, our analysis indicates that the historical probability of losing money in the FTSE 100 over a ten-year period in the last 40 years has been much lower than this, at 3.5%.10 On average, women estimate a higher probability than men of losing money over five years or ten years.
Figure 3 Expected probability of realising a loss from investing in a S&S ISA in equities over a ten-year investment period
Source: Oxera.
This overestimation of risk means that many risk-averse and loss-averse consumers are underinvesting relative to a scenario in which they have more accurate expectations. This effect is greater on average for women, who are both more loss averse on average and more likely to overestimate the probability of a loss from investing.
While it may not be possible (or even advisable) to try to change people’s levels of loss aversion, consumers could be better informed about the likelihood of losing money from investing in S&S ISAs.
Biases play a large role in consumers’ investment decisions, and are as important or more important than demographic characteristics in this regard. But how do these biases link to demographic characteristics and explain the trends that we have found?
Different clusters of consumers
The regression analysis discussed above can tell us about how one characteristic or variable in isolation affects a consumer’s likelihood of investing in a S&S ISA. But how can we find out the combined impact of multiple variables on investment decisions? This is important, as we want to consider how different characteristics interact with each other to influence investment decisions.
To understand the full picture of who is likely to invest, we used clustering analysis, a machine-learning technique that groups data points together based on similarities across multiple variables. This tells us about the groups of consumers that exist when we take multiple variables into account.
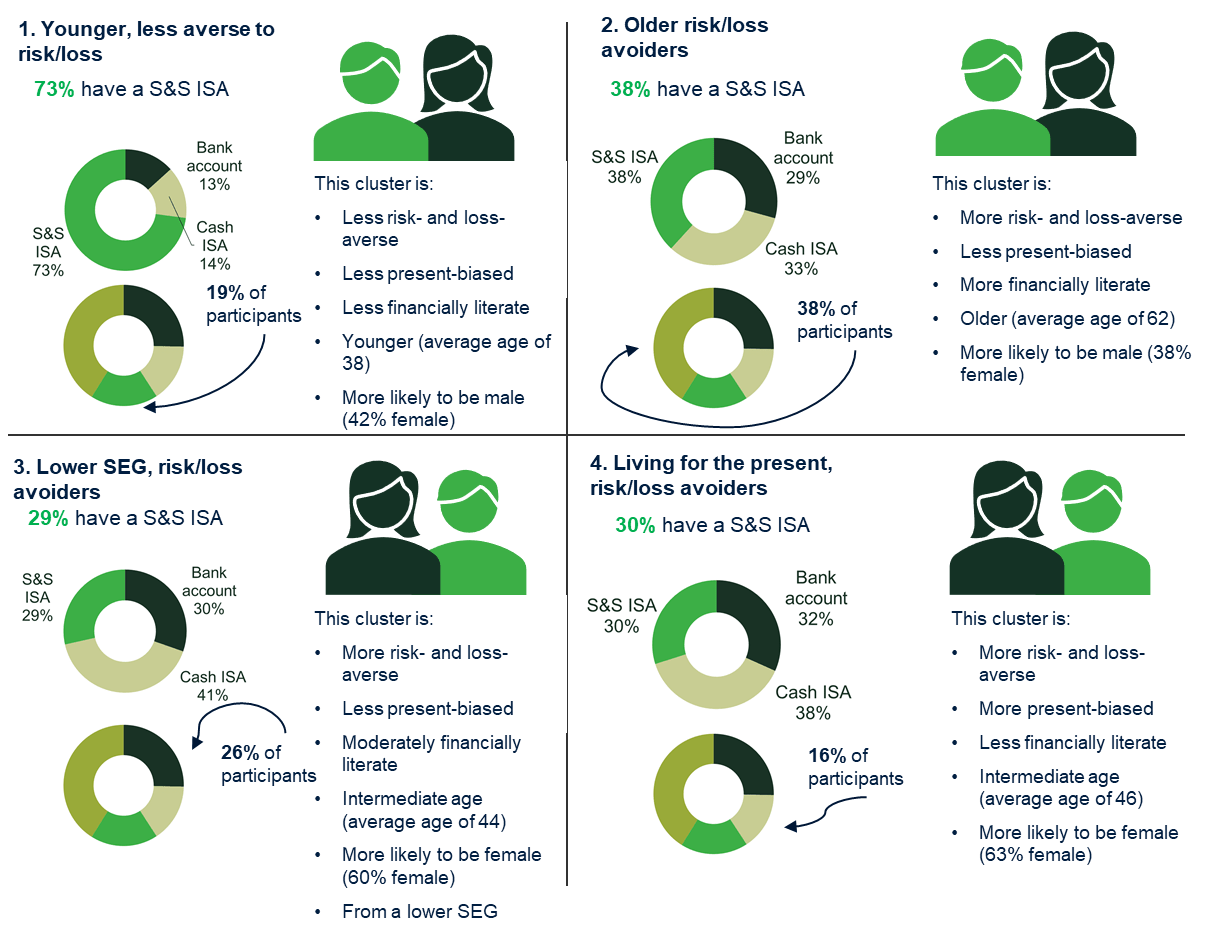
The clustering tells us that there are four groups of consumers that share broadly similar characteristics, as summarised in Figure 4.
Figure 4 The four clusters
Source: Oxera.
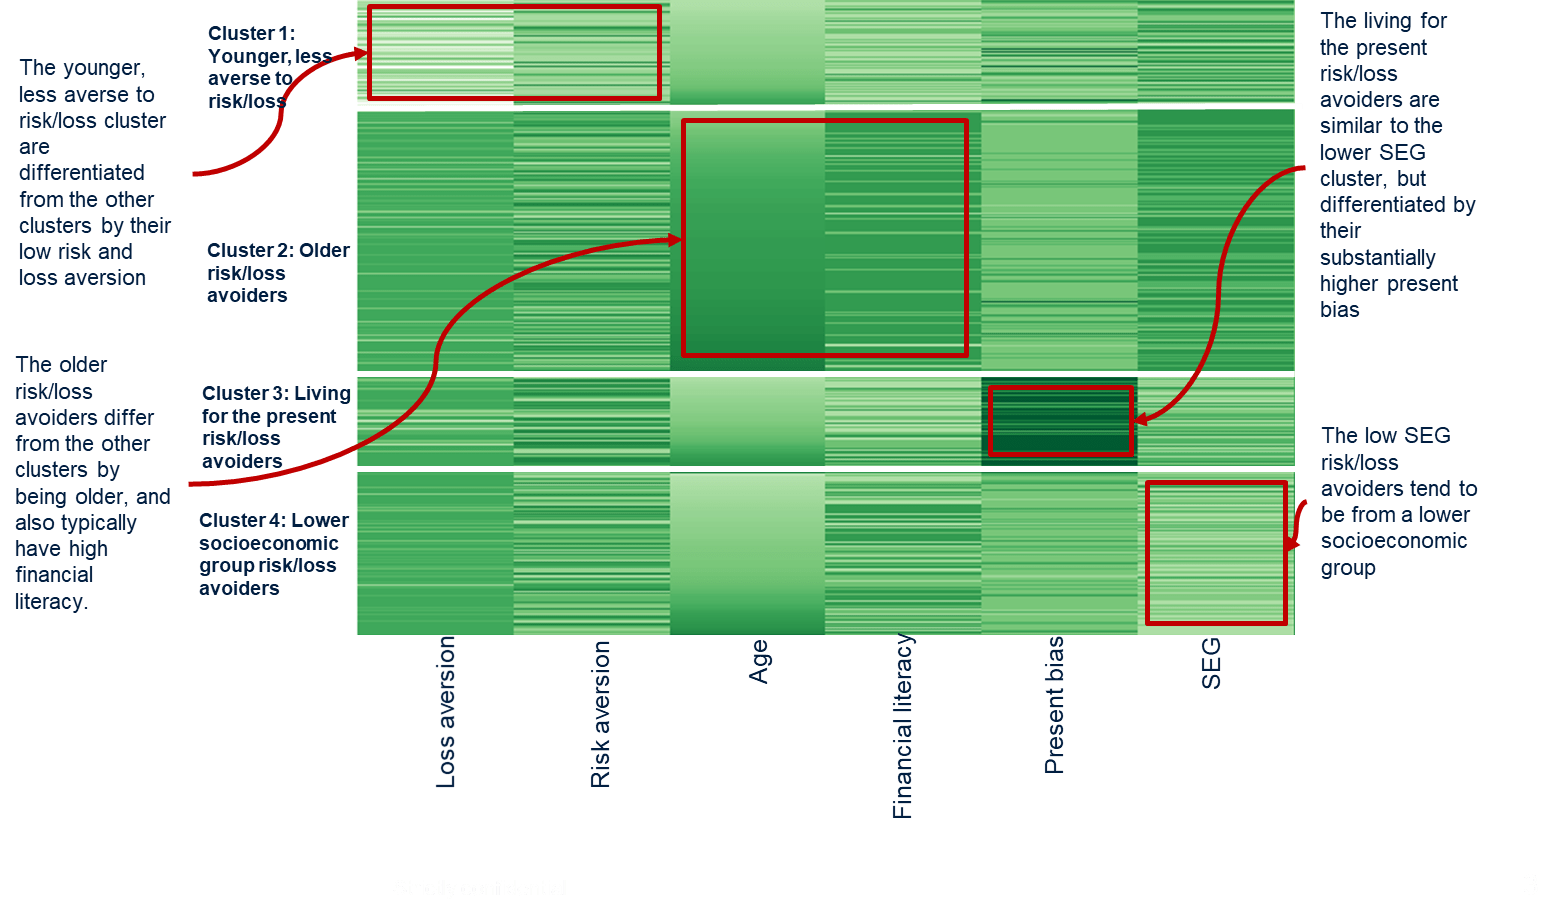
Figure 5 provides a visualisation of the clusters. Each horizontal group represents a cluster, and the vertical categories tell us about the characteristics of consumers within the clusters. Dark green indicates high scores on these variables (e.g. older age, more loss-averse), while light green indicates low scores (e.g. younger age, less loss-averse):
- cluster 1 has many light green rows for risk and loss aversion, indicating many customers with low risk and loss aversion;
- cluster 2 has many dark green rows for age and financial literacy, indicating many customers with high age and high financial literacy;
- cluster 3 has many dark green rows for present bias, indicating many customers with high present bias;
- cluster 4 has many light green rows for socioeconomic groups, indicating many customers in low socioeconomic groups.
Figure 5 Clusters of customers
Source: Oxera.
The clustering analysis further supports the fact that consumers who are less risk averse are more likely to invest in S&S ISAs. The proportion of consumers investing in S&S ISAs in clusters 2, 3 and 4 (which contain more loss-averse consumers) is between 20% and 40%; by contrast, 72% of our sample within cluster 1 has invested in a S&S ISA.11 Taken together with the regression analysis, this implies that the primary driver for investing in S&S ISAs is consumers’ levels of risk and loss aversion.
How to encourage investment?
Several factors converge to mean that certain groups of consumers—in particular, women, older consumers, consumers from a lower SEG and consumers from outside London—are less likely to invest in S&S ISAs, and are therefore more likely to lose out on the benefits of such investments.
The data indicates that peer effects, as well as higher levels of risk and loss aversion, account for some of these patterns. In addition to this, consumers from some of these groups are more likely to severely overestimate the probability of loss from a S&S ISA. When combined with high loss aversion, this may dissuade them from investing.
The good news is that it may be possible to reduce these barriers through better information. While it may not be possible, or advisable, to challenge consumers’ underlying perceptions of risk, their beliefs about the riskiness of certain products can be more easily influenced.
More accurate information around the risks of S&S ISAs is likely to lead to outcomes that are more aligned with consumer preferences. At the same time, peer effects could be positively utilised to encourage more investment in certain consumer groups.
1 Financial Conduct Authority (2021), ‘FCA sets out plan to tackle investment harm’, press release, 15 September.
2 This example compares London with the control group, Wales, but we find that Londoners are also significantly more likely to invest compared to consumers in every other region of the country.
3 Burrell, T. and Cross, R. (2021), ‘Gender, personal finances and Covid-19’, FCA Insight, 24 May.
4 The gender pay gap refers to the hourly earnings differential in the UK between the average male and the average female earner. See Economics Observatory (2022), ‘What do the latest data reveal about the UK’s gender pay gap?’, 15 March.
5 Investable assets include the total value of money held as savings in current accounts, as well as cash savings products (such as savings accounts and cash ISAs), plus the total current market value of any investment products held. Source: Oxera analysis based on Financial Conduct Authority (2022), ‘Financial Lives 2022 survey: insights on vulnerability and financial resilience relevant to the rising cost of living’, 21 October.
6 Kaustia, M. and Knupfer, S. (2012), ‘Peer performance and stock market entry’, Journal of Financial Economics, 104:2, May, pp. 321–338.
7 Strucks, M. and Zeisburger, S. (2022), ‘Why Do People (Not) Invest? The Role of Return and Risk Expectations’, SSRN, 30 January.
8 We assessed this using a question by Holt and Laury (2002), which asks consumers to choose between two lotteries. See Holt, C.A. and Laury, S.K. (2002), ‘Risk Aversion and Incentive Effects’, American Economic Review, 92:5, July, pp. 1644–55.
9 We measured this through a lottery question that asks consumers to select the largest amount of money they would be prepared to risk in a lottery in which they had 50% chance of losing and 50% chance of winning £500.
10 According to Oxera analysis based on FTSE 100 data from the past 40 years. The analysis assumes 0.5% asset management fees. We cannot comment on the future likelihood of losing money in a S&S ISA.
11 The 72% figure refers to the proportion of younger risk-seekers in our sample who have invested in a S&S ISA, not the proportion of younger risk-seekers in the wider population who have invested in a S&S ISA. This is because we targeted our sample at consumers who have invested in S&S ISAs, in order to make sure we could analyse what makes these consumers different from others. The end result is that we have a higher proportion of consumers who have invested in S&S ISAs in our sample than in the UK population. Therefore, we should interpret the clustering results as being broadly indicative of which types of consumer are likely or unlikely to invest in S&S ISAs.

Related

The two realities of operations: how process mining could reshape regulation
There are two distinct realities operating simultaneously in all organisations: (i) the theoretical, represented by policy documents, flowcharts and training manuals; (ii)the practical, or what actually happens across systems and teams and the necessary workarounds needed when things go wrong. Process mining is a data-driven discipline designed to uncover… Read More

Oxera AI policy map – June 2026
For this fourth edition of the AI Policy Map,1 we have updated our database that tracks key national and supranational AI policy developments across the European Economic Area (EEA) and the UK. This curated collection brings together legal texts, strategy documents and other influential publications relevant to… Read More