
The X factor: what is the productivity target for German gas utilities?
In December 2017, BNetzA set 0.49% p.a. as the Xgen for gas networks for 2018–22.1 Oxera—together with Associates, Professor Subal C. Kumbhakar and Professor Emmanuel Thanassoulis, and Project Adviser, Dr Dimitris Giraleas—advised the German organisation for energy and water companies (BDEW) throughout the process.
Now that the dust has settled, it is time to take stock. This article looks at what the Xgen is, and why it attracts industry-wide attention (which is unusual for complex methods).2 It then describes the journey towards the latest consultation on setting the Xgen for gas networks, and looks ahead to this year’s consultation for the electricity network operators.
What is the Xgen and why does it matter?
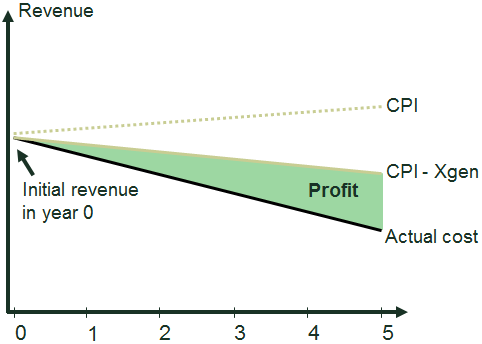
The productivity factor, or Xgen—in other words, the X in CPI – X—has a substantial impact on utilities’ revenues. At least part of the network’s allowed revenue is uprated annually by CPI – Xgen, where CPI is the consumer price index. Figure 1 illustrates the CPI – Xgen concept: the higher the Xgen, the lower the revenues of the gas network.
Figure 1 Stylised illustration of CPI – Xgen
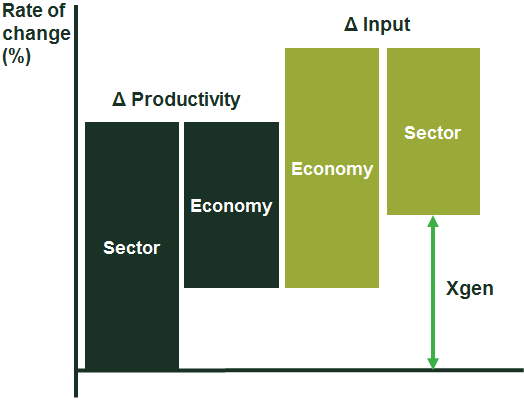
As illustrated in Figure 2, the Xgen is derived by combining the following:
- the difference between the productivity rates (total factor productivity) of the relevant sector and the whole economy; and
- the difference between the change in input prices of the whole economy and the relevant sector.
Figure 2 Stylised illustration of the definition of the Xgen
The term ‘productivity factor’ may be somewhat misleading: it encompasses not only productivity changes in the relevant sector, but also productivity changes in the whole economy. In other words, the Xgen reflects a productivity differential (and also an input price differential).
Even if the Xgen were determined to be zero, companies’ allowed revenues would still be adjusted to take into account productivity progress. This is because revenues would be uprated by CPI, which reflects developments in input prices as well as the productivity progress of the whole economy. Hence, if the Xgen is positive, this implies that productivity progress in the relevant sector will be greater than in the rest of the economy (assuming, for simplicity, no changes in input prices).
So, why does the Xgen matter? As discussed previously in Agenda, the Xgen is a small number, but one that can have a large impact.3 The Xgen as it currently stands would reduce the allowed revenues of the industry by 0.49% in the first year and 2.47%4 in the last (i.e. fifth) year of the regulatory period, with an overall impact of approximately €400m.5
The twists and turns of the consultation process
The Xgen was set at 1.25% p.a. for the first regulatory period (2009–12) and at 1.50% p.a. for the second period (2013–17), with the value set through political decision (in the government’s Incentive Regulation Ordinance) rather than empirical analysis.6 This time is different. For the third regulatory period (2018–22), the legislation requires BNetzA to set the productivity factor using ‘state-of-the-art scientific methods’.7
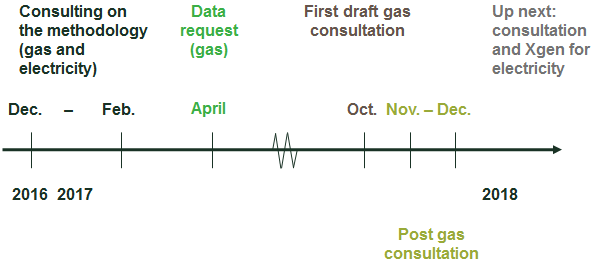
The different stages are shown in Figure 3 and discussed in turn below.
Figure 3 Consultation timeline
Consulting on the methodology (gas and electricity)
Given the new Incentive Regulation Ordinance, in mid-2016 BNetzA began a consultation on the methods for setting the Xgen for gas and electricity networks. Well-established methods—the Törnqvist and Malmquist approaches—were suggested by BNetzA’s consultant, together with a ‘synthetic index’ method (as described in the box).8
Overview of the Törnqvist, Malmquist and synthetic index methods
The suggested Törnqvist method would use data from the German energy sector collected by the national statistical office (as detailed data specific to the gas network sector is not available from public sources). In relying on public data, which is available on an annual basis over a period of at least 20 years, this index method would be helpful in understanding and controlling for the effects of investment cycles. However, it has a number of limitations. First, it relies on data that is available only at a high level of aggregation (at the complete energy supply chain level, not just gas network data). Furthermore, the approach cannot assess whether the productivity progress measured represents genuine technical progress—i.e. ‘frontier shift’, which is defined by the sector’s efficient network operators—or rather companies catching up to industry best practice (i.e. ‘catch-up’). Separating this catch-up is relevant in so far as the Xgen is supposed to capture only the frontier shift, and not the catch-up.
The suggested Malmquist method would be based on sector-specific data, and it would allow for actual technical progress and catch-up to be disentangled. However, the collected data might not be fully consistent over time and is available for only three points in time, about five years apart—which can make it challenging to assess the stability of the results.
The suggested ‘synthetic index’ method uses data from other industries that are comparable to the gas network sector. It is essentially a Törnqvist method, but is intended to mimic the development of the relevant sector by choosing data from other sectors.
Note: For further details on the methods, see Färe, R., Grosskopf, S., Norris, M. and Zhang, Z. (1994), ‘Productivity Growth, Technical Progress, and Efficiency Change in Industrialized Countries’, American Economic Review, 84, pp. 66–83; Ray, S.C. and Desli, E. (1997), ‘Productivity Growth, Technical Progress, and Efficiency Change in Industrialized Countries: Comment’, American Economic Review, 87, pp. 1033–39; and Törnqvist, L. (1936), ‘The Bank of Finland’s Consumption Price Index’, Bank of Finland Monthly Bulletin, 10, 1–8.
Source: Oxera.
The subsequent gas and electricity consultation in February 2017 highlighted some concerns regarding these methodologies, as follows.
- An Oxera study conducted at the time of the regulator’s methodology paper demonstrated that the results from a similar Törnqvist approach vary considerably with the period of analysis—i.e. from year to year. The study concluded that the Xgen of the German gas networks following such an approach may not be very different from 0%.9
- The Malmquist approach would be based on data from just three years, making a robust analysis more challenging.10
- The ‘synthetic index’ method would depend mainly on the choice of input time series from other sectors; however, German law prescribes that data from network companies should be used.11
It thus became clear that none of the methods represents a ‘silver bullet’.
Data request (gas)
These concerns were taken into account by the regulator. In April 2017, BNetzA decided to collect data from several hundred gas network operators from 2006–16.12
While this caused some turbulence in the industry (which had to gather the data at short notice), the data eventually proved to be useful in setting the Xgen. It also meant that network-specific data was available over time, such that trends in productivity progress, influenced by investment cycles, could be better understood.13
First draft gas consultation
In the first draft of the subsequent consultation published in October 2017, BNetzA suggested basing its decision on two models:
- the Törnqvist method using network operators’ data with an Xgen of 0.76% p.a.;
- the Malmquist method based on benchmarking data with an Xgen of 1.00% p.a.
Based on these two approaches, BNetzA suggested setting an average Xgen of 0.88% p.a.14
BNetzA also presented the industry with a ‘gas network operator Törnqvist tool’. This contained gas network sector data (aggregated from the individual utilities’ responses to BNetzA’s data request) and the Törnqvist calculations and results.
The modelling approach followed by BNetzA incorporated suggestions by the industry and Oxera.15 These points related to the appropriate output measure (revenue or quantity) and the modelling of input prices (in particular, the prices of capital), among other aspects. Over the course of the consultation, the analytical approach has developed, in part following suggestions by the industry and Oxera.
Towards the end of the consultation, BNetzA also published the data and codes underpinning the Malmquist model.
The review of these documents by Oxera and the industry identified several issues, including the method used to calculate capital prices, spreadsheet issues, and issues with the aggregation of the different Xgen values given differences across firms.16
Post gas consultation: preliminary setting of the Xgen
Due to the delayed schedule, BNetzA granted the industry a ‘post consultation’. BNetzA’s updated draft consultation in November 2017 and its preliminary decision in December 2017 incorporated the suggestions and introduced further adjustments to the analysis.17 This included adjustments to the calculation of capital prices, addressing the spreadsheet issues, and introducing a more cautious approach to setting the Xgen by choosing the lower value produced by the two methods—the 0.49% p.a. calculated by the Törnqvist method, as opposed to the 0.90% p.a. calculated by the Malmquist method.
Although work on the Malmquist model is ongoing, as the Xgen is now based on the Törnqvist tool it is unlikely that the final assumption for the Xgen will differ from 0.49% p.a.
Lessons and outlook
The above discussion highlights the path that the regulator has undertaken in arriving at a methodology for setting the Xgen for gas networks. Three key lessons can be drawn from the consultation exercise.
- Transparency is key—it is helpful to have a transparent process whereby data and codes for the Xgen calculation are published. This gives stakeholders a chance to engage in an informed way with the regulator to understand the drivers of the Xgen, and make other suggestions to develop the work.
- Complexity will not go away—it is important that the parameters of the regulatory control are correct, especially since a small change in the Xgen can have a large impact. Sometimes—as was the case in this consultation—this requires complex analysis.
- There is no silver bullet—no model is perfect and different approaches will always have different strengths and weaknesses. While robust analysis helps the regulator to make informed decisions, a certain amount of judgement is likely to remain necessary in the foreseeable future.
So, what next? It remains to be seen whether BNetzA’s new transparent approach will prevent regulated companies going down the legal road (again) and taking action against BNetzA’s decisions.
A similar consultation for electricity networks is on the way, and this time BNetzA is collecting even more data, which will potentially allow more quantitative approaches to be applied to it.
Dr Anton Burger
1 Bundesnetzagentur (2017), ‘Vorläufige Anordnung genereller sektoraler Produktivitätsfaktor Gas’, BK4-17-093, December.
2 Complex methods include statistical methods, index methods and non-parametric estimation techniques.
3 Oxera (2017), ‘Small number, big impact: the productivity factor for energy networks in Germany’, Agenda, March.
4 (1+0.49%)5-1=2.47%.
5 This follows from Bundesnetzagentur (2015), ‘Evaluierungsbericht nach § 33 Anreizregulierungsverordnung’, p. 135.
6 Article 9 (2) of the Incentive Regulation Ordinance (Anreizregulierungsverordnung, AregV).
7 Article 9 of the Incentive Regulation Ordinance (Anreizregulierungsverordnung, AregV).
8 Wissenschaftliches Institut für Infrastruktur und Kommunikationsdienste GmbH (2016), ‘Gutachten zur Bestimmung des generellen sektoralen Produktivitätsfaktors’, Studie für die Bundesnetzagentur, 16 December.
9 Oxera (2017), ‘Bestimmung des generellen sektoralen Produktivitätsfaktors für Strom- und Gasnetzbetreiber’, Untersuchung für den BDEW Bundesverband der Energie- und Wasserwirtschaft e.V., 6 February.
10 BDEW (2017), ‘Bestimmung des generellen sektoralen Produktivitätsfaktors’, Stellungnahme, 6 February.
11 Ibid.
12 Bundesnetzagentur (2017), ‘Datenabfrage Xgen Gas’, BK4-17-004, April.
13 BNetzA has now also requested data from electricity network operators for the upcoming electricity consultation in 2018. For details, see Bundesnetzagentur (2018), ‘Datenabfrage Xgen Elektrizität’, BK4-17-094, January.
14 Bundesnetzagentur (2017), ‘Konsultationsentwurf genereller sektoraler Produktivitätsfaktor Gas’, BK4-17-093, October.
15 For example, see the discussion of the Törnqvist output index on p. 19 of Bundesnetzagentur (2017), ‘Vorläufige Anordnung genereller sektoraler Produktivitätsfaktor Gas’, BK4-17-093, December.
16 Oxera (2017), ‘Wissenschaftlicher Standard zur Ermittlung des Xgen. Eine Studie für den BDEW Bundesverband der Energie- und Wasserwirtschaft e.V.’, November; and BDEW Bundesverband der Energie- und Wasserwirtschaft e.V. (2017), ‘Festlegung X Generell Gas. Stellungnahme’, November.
17 Bundesnetzagentur (2017), ‘Papier zur Nachkonsultation. Änderungen gegenüber dem bisherigen Konsultationsstand vom 12.10.2017’, BK4-17-093, November; and Bundesnetzagentur (2017), ‘Vorläufige Anordnung genereller sektoraler Produktivitätsfaktor Gas’, BK4-17-093, December.
Download

Related

Draft merger guidelines: can we ensure dynamic and innovative markets flourish in Europe?
The European Commission’s draft merger guidelines are one of the most important ongoing debates in European policy. Nearly two decades have passed since the guidelines were last reviewed, and the new draft draws upon years of practice and precedent — reassessing core concerns around market power and consumer harm in… Read More

Ofgem’s RIIO-ED3 SSMD: what next for GB electricity distribution networks
On 21 May 2026, Ofgem published its Sector Specific Methodology Decision (SSMD)1 for the forthcoming RIIO-ED3 (ED3) price control for GB electricity distribution network operators (DNOs). We explore some of the key themes in the Decision, ahead of the upcoming business planning period and the expected publication of… Read More