
Undertaking capital projects: linking risk and return
Whether they relate to the energy transition, the renewal of transport infrastructure, or reversing damage to the environment, our society will increasingly need to undertake large capital projects. It will be important to identify the projects’ risks and determine who is responsible for managing these and reducing their likelihood. What are some of these major construction risks, and what models can we use to quantify their risk and return?
We live in uncertain times, which increases the risks for major projects at a point when they are becoming more and more necessary. The distinction between uncertainty and risk is that uncertainty covers the ‘unknowns’ (which are themselves divided into known and unknown1), whereas risks are known and open to analysis, both qualitative and quantitative.
Construction projects are especially risky. Some of the reasons for this are clear, such as the weather or the potential for difficult ground conditions. Other reasons are less obvious: for example, they may affect a wide range of interested stakeholders, some of whom will be opposed to the project and have the potential to contribute to delays or influence the specification of work, thereby increasing costs. Risk analysis must therefore extend back to the origins of the project. Analysis of construction cost overruns in Norway has revealed that many of the decisions leading to cost overruns above the initial estimate occurred before the Final Investment Decision (FID), or even before the start of Front End Engineering Design (FEED).2
Risk to whom?
It is also important to be clear about the question of ‘risk to whom?’. In a construction project there are usually multiple actors, or at least two—the owner and the contractor.3 Risk is transferred between owner and contractor through the terms of the contract. At one extreme there is a fixed-price contract, where the contractor bears all the risk except for specified events. At the other there is a cost-plus contract, where the owner is exposed to the full cost of the projects plus a profit margin. There are also intermediate ‘alliance-contracting’ arrangements, which are especially useful where there is a degree of uncertainty in the work required. Gain-sharing arrangements are put in place to encourage cooperative behaviour.
While it may initially seem beneficial to the owner to transfer as much risk as possible to the contractor, this is not necessarily the case. If there are substantial risks, transferring all of them will simply lead to large contingencies being added to the bids, if indeed any are received. The general rule is that risk should be borne by the party that is best placed to manage it.
The topic of risk management in general is outside the scope of this article.4
Owner–contractor relations
An approach to ‘alliance contracting’ supported by the UK’s Institution of Civil Engineers, and termed ‘Project 13’,5 aims to encourage the owner and contractor to engage in mutually beneficial cooperation, rather than confrontation (even powerful owners may not benefit from an adversarial approach if the result is a bankrupt supplier).
The design of contracts and risk transfer across parties is often called the ‘delivery strategy’. A related but less obvious form of risk transfer is the owner’s staffing strategy. In practice, an owner may not be able to afford to hire all the necessary skills for the management and design of a project, and will rely on the contractor’s staff. While this may be attractive in the short term, it leads to a shift of power in the relationship that could increase costs to the owner in the long run6—no matter how much the owner aspires to be an ‘Intelligent Client’.7
When answering the question of ‘risk to whom?’, the perspective we take is that of the owner. In some cases, for example with public–private partnerships, a special-purpose vehicle will be created to own the asset and receive debt and equity financing. Although created for the construction of the asset, it will continue during the operation of the asset, receiving payments for the services delivered or for asset use. Even if a separate legal entity is not created, the ‘project’ or ‘programme’ is usually given a distinct organisational form, with the asset being handed over to the operational side of the business once it is complete. This allows a boundary to be drawn around the project and for its costs to be tracked separately.
Whole-life cost
Estimating the costs of the contract throughout a project begins with an estimate of the base cost. Much of the work falls to a quantity surveyor or cost engineer, although work cannot begin without a clear view of the project specification. This itself will have arisen from an option selection exercise, to establish the need for the project, and determine whether it fits the organisation’s purpose. Once this is done, the project will have to be selected to enter the project portfolio. An appropriate budget will have to be set during a pre-feasibility study, to confirm that the proposed project is affordable. At this stage, the project design is not yet fixed. There is still flexibility in the design, and subsequent detailed feasibility studies will be undertaken to select the variant that offers the most attractive value for money, with construction cost being an important element in the choice.
Once the preferred option is selected following the feasibility study, it becomes possible to estimate the base cost over the whole life of the project. This typically takes the form of an S curve,8 with:
- a slow rate of expenditure at the early stages of seeking approval;
- acceleration once engineering design begins, followed by a fast rate of spending during construction;
- a reduction in the spend rate during commissioning.
It should be noted that fairly inexpensive early activities have the potential to affect the whole-life cost or schedule, and it may be beneficial to increase early expenditure, a process known as front-end loading. The whole-life costs can be condensed into a single figure in a net present value (NPV) calculation.9
The major cost elements will be labour, materials and plant.10 At this stage, project contingencies will be discussed along with the degree of ‘optimism bias’ in the initial estimates.11 The estimates of optimism bias will depend heavily on expert judgement and historical data on project overruns in similar projects. There is currently some interest in using reference class forecasting to set budgets, whereby the internal view of the project contingencies is supplemented by an external comparison of similar projects within the reference class to obtain a more rounded view of possible overruns. In setting project contingencies,12 the first step is to undertake qualitative risk analyses to identify risks and the parties that bear them, followed by quantitative risk analysis (QRA), typically involving Monte Carlo analysis.13
Despite the popularity of QRA, there is no guarantee about the robustness of its findings. Even if a probability distribution for the risks can be established (which may consist simply of a three-point estimate of a minimum, maximum and most likely cost), other assumptions are required about the correlations between these input cost functions. In the absence of any other information, the risks are typically assumed to be independent (i.e. uncorrelated), but in practice this may not be the case. There may be a common cause, or a cascade of risks, where one failure leads to another. As a result, systemic risk can be overlooked.
A further issue is that a major source of risk is ignored: design immaturity. Research on past overruns by the benchmarking, research and consulting organisation Independent Project Analysissuggests that poor design definition is a predictor of cost overrun—but that conventional QRA, even if supported by Monte Carlo analysis, is not, if the design is immature.14 Fortunately, design maturity can be measured using publicly available tools such as the Project Definition Rating Index (PDRI),15 so this particular gap can be filled during the FEED stage before the FID, and a more reliable QRA can be produced, suitable for linking risk and return.
Linking risk and return
It is possible to produce a base cost life cycle cost estimate for construction, and to use this in an NPV calculation to create a net present cost for the construction phase of a project. During the operations phase, revenues should then exceed operating cost, with the positive cash flow shown at the end of the construction phase—allowing for the project’s internal rate of return (IRR) to be calculated.16 Ideally, the IRR will exceed the threshold required for the project to proceed. However, this could be an overly optimistic decision, if risk is not considered.
To account for construction risk, a second whole-life analysis should be undertaken, with the higher risk-adjusted costs and a delayed schedule, as estimated by the risk analysis. This will produce a lower IRR, and the difference in IRR represents a negative premium for construction risk.17 A simple worked example is provided in the box below. Particular scenarios can also indicate the robustness of the project business case to particular risks. Brougheland and Wüstenhagen (2022) provide an example of this in the renewable energy sector.18
Impact of risk on project IRR
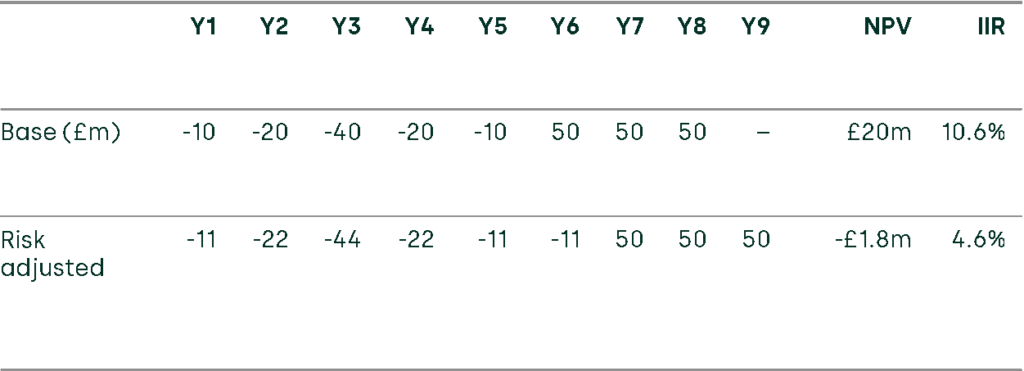
Assume a five-year construction project with base costs, and three years of forecast revenue, as shown in the ‘Base’ row in the table below. With a discount rate of 5%, the NPV is £20m, and the IRR is 11%.
If the risk adjustment shows a 10% increase in costs with an additional year of commissioning at the end of the construction (a fairly minor case of cost and schedule overrun), the NPV is negative and the IRR drops to 4.6%, which is lower than the cost of capital.
The risk adjustment to the costs and schedule has therefore led to a reduction in the IRR of 6%.
Source: Oxera.
It is not only possible to calculate IRRs for particular scenarios, but also to estimate probability distributions of alternative costs and schedules (if data is available) to produce a probability distribution of the resulting project IRR. This can identify the risk that the IRR will fall below the threshold for the project proceeding.
Acting on the results
If the above analysis shows that the project IRR is sensitive to particular risks, there will be a need to take corrective action. One option is to transfer the risks directly, for example through insurance, or by using contractual approaches to transfer risk to contractors—if they are prepared to accept them. Other approaches may involve managing risk by reducing vulnerability (for example, using off-site indoor construction to avoid weather-related risks), or reducing the consequences of an adverse event (for example, putting in contingency planning for industrial action). If there are concerns over the maturity of a new design then a PDRI can be commissioned. The effect of the risk treatment will be to reduce the construction risk premium.
Not all risks will be physical. A delay in the start of construction, or in completing engineering design, will lead to a delay in the expected revenues—leading them to be more heavily discounted and therefore having a lower present value.
What can we do to reduce risk?
Linking project risks to the IRR draws a link between risk management and construction on the one hand and finance on the other. The real-world risk of construction projects can be linked to the financial concepts of a project’s IRR—which means identifying sensitivities and potential remedies, which might involve revised contractual terms, more robust designs or better stakeholder management.
An early risk review exercise (with a broad remit) may be useful, to consider whether all the aspects of risk have been recognised. These risks could range from stakeholder reactions to planning approvals, assessment of design maturity, quantification of systematic and idiosyncratic risks, and contingencies for extreme events. This extends front-end planning beyond the engineering domain to the project as a whole, including the business case on which the project depends.
1 Department for Transport (2022), ‘TAG Uncertainty Toolkit’.
2 Welde, M. and Odeck, J. (2017), ‘Cost escalations in the front-end of projects – empirical evidence from Norwegian road projects’, Transport Reviews, 37:5, pp. 612–630, DOI: 10.1080/01441647.2016.1278285. The FID marks the start of construction, and activity prior to the FID includes selection of the project for inclusion in the portfolio following a pre-feasibility study; full feasibility studies; applications for permits and development consents; and FEED. These activities all require both cost and risk assessments.
3 The owner may also be referred to as the client, employer, developer or principal, depending on the circumstances. There are cases where the owner also undertakes the construction work; for example, in direct labour organisations of local authorities in the UK, such work tends to be for minor works, or repair and malignance.
4 Instead see, for example, two publications from the UK government: the risk management module of its Project Routemap, and its Construction Playbook. Infrastructure and Projects Authority (2022), ‘Project Routemap: Setting up projects for success’, Risk Management. HM Government (2022), ‘The Construction Playbook: Government Guidance on sourcing and contracting public works projects and programmes’, Version 1.1, September.
5 See Project13 website (2023).
6 Milrod, L. and Sparks, S. (2020), ‘Making Intentional Staffing Decisions To Preserve Core Owner Functions’, Independent Project Analysis, 3 April.
7 Government Property Function (2022), ‘Guidance: Intelligent Client Roles ̶ Functional Guidance’, 11 November.
8 The mathematical formula for an S curve is S(x) = (1/(1+exp(-k.x))^a, where the constants ‘k’ and ‘a’ control the shape of the curve.
9 This requires the selection of a discount rate, reflecting the systematic risk of the project and the opportunity cost of capital.
10 Project financing costs should not be included in the NPV calculations, but they are significant and controllable and interest costs can be capitalised.
11 Optimism bias is the tendency for estimates of project cost and schedule to be underestimated. For more details, see HM Treasury (2013), ‘Green Book supplementary guidance: optimism bias’, 21 April.
12 Project contingencies are held outside the main project estimate, but form part of the project budget. In a simple case they are held by the project manager for release as required. In more complex projects there is a tiered system of contingencies, to be released at increasing levels of authority if spends become significant.
13 Monte Carlo methods predict the probability of outcomes using repeated random sampling of inputs, based on their probability distributions and their correlations.
14 Munchi, A. (2022), ‘Cost And Schedule Risk Analysis: Current State And Opportunities’, Independent Project Analysis, 4 May.
15 See Construction Industry Institute (2023), ‘Project Definition Rating Index (PDRI) Overview’.
16 Where the project financing cost of capital differs from the rate used to reinvest the proceeds of the project, the modified IRR should be used.
17 This is an ‘idiosyncratic risk’, or unsystematic risk, specific to a project, which is distinct from the systematic risk that is reflected in the discount rate. The idiosyncratic risk should not be included in the discount rate if the NPV analysis is using risk-adjusted costs, as this will lead to double-counting.
18 Brougheland, A. and Wüstenhagen, R. (2022), ‘The Influence of Policy Risk on Swiss Wind Power Investment’, in P. Hettich and A. Kachi (eds), Swiss Energy Governance, Springer, p. 345.
Related

The two realities of operations: how process mining could reshape regulation
There are two distinct realities operating simultaneously in all organisations: (i) the theoretical, represented by policy documents, flowcharts and training manuals; (ii)the practical, or what actually happens across systems and teams and the necessary workarounds needed when things go wrong. Process mining is a data-driven discipline designed to uncover… Read More

Oxera AI policy map – June 2026
For this fourth edition of the AI Policy Map,1 we have updated our database that tracks key national and supranational AI policy developments across the European Economic Area (EEA) and the UK. This curated collection brings together legal texts, strategy documents and other influential publications relevant to… Read More