
The Oxera Energy Model: price coupling in the European energy mix
Oxera’s new Energy Model enables detailed analysis of a range of future scenarios involving the energy generation mix in Europe. The interactive map below showcases one example relating to price coupling. (For an introduction to this topic, see Oxera’s Agenda article from April 2023.)
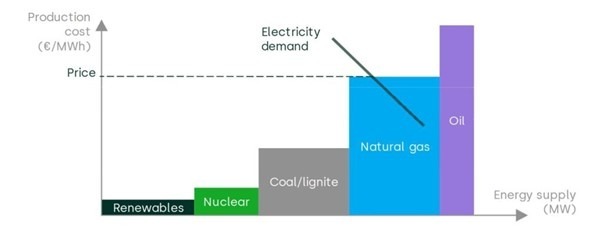
In European electricity markets the generators that are allowed to produce at each moment in time are those with the lowest production costs (marginal costs). The price is set equal to the production cost of the most expensive generator that needs to run in order to meet demand, which is known as the marginal generator. This is illustrated in the figure below.
‘Inframarginal’ generators (i.e. renewables, nuclear and coal/lignite in the example below) make profits equal to the area gap between their production cost and the price. Especially for renewables this can mean very high returns in any hour in which they operate as an inframarginal generator.
The electricity market price-setting mechanism
The production costs of fossil generators are closely linked to their fuel costs (e.g. gas or coal). This implies that whenever the marginal generator is fossil fuelled, the electricity price is linked to the price of a fossil fuel commodity. This is referred to as price coupling. Due to recent geopolitical events such as the increased gas prices (and thus electricity prices) as a result of the war in Ukraine, price coupling has started to be seen as an undesirable phenomenon.
The map from the Model shows the share of electricity from variable renewable sources (vRES) (i.e. wind and solar power), hydropower and nuclear power in each of the Model’s regions in the circular pie chart markers.1 The shading of the countries reflects the percentage of hours in the displayed year in which a vRES, hydropower or nuclear power generator is the marginal generator in that country.2 The marginal generator does not need to be located in that country, as it can also be the marginal generator due to imports.
These technologies (vRES, hydropower and nuclear power) are grouped together because they represent technologies whose variable costs are unlikely to be affected by fuel prices (in contrast to, for example, gas or coal generators).
The map shows that countries with a larger vRES, hydropower and nuclear share of total generation have more non-fossil marginal generator hours (and vice versa). Furthermore, the map shows that, as time progresses, vRES, hydropower and nuclear take up a larger share of total generation.3 Together, this points to a decoupling of the energy price and commodity prices such as oil, gas, coal and biomass.
Looking at the results in 2045, the Model suggests that relying solely on vRES, hydropower and nuclear generation across the entire system is not feasible. This is shown by the fact that in many regions the share of vRES, hydropower and nuclear is still well below 90% in 2045.
It is interesting to note, however, that even in countries such as Sweden in 2045 with near 100% vRES, hydropower and nuclear generation decoupling is limited to approximately 77%.4 This suggests that it is not economically feasible to add sufficient vRES, nuclear and hydropower capacity into the system to completely uncouple the energy price from thermal fuel prices under the current market structure.
A core reason why price decoupling is unfeasible under the current market structure is the following.
In a situation where non-fossil generators can fulfil the entire demand a lot of the time (such as in larger geographic regions, because wind and solar generation are geographically smoothed), the energy price will be very low, as in those hours the marginal generator will be a renewable energy plant with close to zero marginal costs. With such low prices, additional investment into non-fossil energy sources will be unattractive as investment costs are less likely to be recovered. At the same time, the additional vRES capacity would potentially push the price down even further. The positive (i.e. reinforcing) feedback loop, where greater quantities of installed vRES lead to progressively lower prices on average, is often referred to as ‘price cannibalisation’. Absent other sources of revenue (such as state subsidies), investment in non-fossil capacity will occur only up to the point where energy prices are still high enough for investment costs to be recuperated.
Other things being equal, price cannibalisation is more pronounced in smaller markets with limited interconnection capacity, since wind and solar generation would each be more likely to be strongly correlated. Once the demand is close to being consistently fulfilled during hours with peak vRES generation, market prices alone would be insufficient to remove fossil fuelled generators entirely from the capacity mix, at least with the current market designs. It is important to note that continued reliance on some fossil fuel generation does not mean that the system cannot be net zero. The expansion of carbon capture and storage (CCS) technology may in future significantly reduce the emissions from the non-renewable power plants that remain in a system with limited price coupling.
Meanwhile, many market reforms have been proposed to further mitigate price coupling, and some of these are discussed in our previous Agenda article. These changes include:
- capping the revenues of inframarginal generators;
- encouraging (or requiring) inframarginal generators to take part in schemes based on contracts for differences (CfDs);
- splitting existing wholesale markets into separate markets for ‘firm’ and ‘variable’ power.
The Oxera Energy Model
The Oxera Energy Model creates and simulates an optimal generation plan for most of Europe as shown in the map above, between 2025 and 2050. The optimal functioning of generators (i.e. when to turn which generator on or off) is determined by minimising the total system cost subject to a variety of technical and economic constraints.
The Model is developed in PLEXOS, a market-leading software package specifically designed for modelling complex energy systems. The Oxera Energy Model is based on a large variety of sources, including ENSTO-E and ENTSOG’s Ten-Year National Development Plan (TYNDP).
The Model reports on two levels of geographical detail: countries and regions. Regions are sub-areas of those countries in which there are multiple price zones.
In the Oxera Energy Model, the development of the capacity mix is governed by two factors:
- government plans as formulated in the TYNDP;
- expansion decisions made by PLEXOS to minimise the net present value of generation.
The scenario modelled and discussed in this article is the most economical scenario. It does not reach net zero. The model is undergoing continuous development and we are currently creating a net zero scenario that could potentially establish a higher level of decoupling between energy and fossil fuel prices.
1 The small pie charts on the map represent the share of generation from vRES, hydropower and nuclear power sources. More detail on the generation mix can be seen by clicking on these markers.
2 Tip: you can also use the sliders in the interactive legend to highlight the country with the highest share of vRES, hydropower and nuclear marginal generator hours and then move the time slider to find the highlighted country (this feature is not available on smaller screens, such as phone screens).
3 The year displayed on the map can be changed by dragging the slider at the bottom.
4 This can be seen on the Map by dragging the time slider to the far right and hovering over Sweden to reveal the tooltip.

Related

Modernising EU competition policy: from guidelines to outcomes
This special edition of Top of the Agenda was recorded at our 2026 Brussels conference, which hosted senior figures from the European Commission, national competition authorities, academics and the legal community to discuss one of the most significant developments in EU competition policy in two decades: the revision of… Read More

When does a discount become deceptive? An economic framework for the regulation of reference pricing
The use of ‘reference’ pricing—where a previous (or future) ‘was’ price is displayed alongside the current ‘now’ price to indicate a discount for customers—is a common feature across digital and physical markets. In supermarkets, retailers commonly advertise a headline Recommended Retail Price (RRP), or ‘was’ price, alongside the current… Read More