
Small number, big impact: the productivity factor for energy networks in Germany
The German Federal Network Agency (Bundesnetzagentur, BNetzA) is currently determining the general productivity factor (Xgen) for all electricity and gas networks in Germany. This factor is intended to reflect the productivity gains that an efficient network operator would be expected to achieve as a result of technological progress or cheaper inputs. In a project for Germany’s utility association, BDEW, Oxera used advanced methods to calculate a general productivity factor for German energy networks of around 0%.
Market economies rely on competition to balance supply and demand, to ensure that prices are fair, and to encourage companies to seek out cost-effective and innovative production technologies. Electricity and gas networks, however, tend to be natural monopolies in which competitive market pressures are weak or absent. Operators of these networks are regulated to ensure that they do not earn monopoly profits, and that they operate as cost-efficiently as possible.
Under the German incentive regulation framework for energy networks, operators’ revenues are regulated using a revenue cap. The general productivity factor (the ‘general X-factor’ or ‘Xgen’) has a significant impact on operators’ revenues in the regulatory formula. BNetzA estimates that increasing the factor by 0.5 percentage points reduces total revenues of all network operators by about €1.15bn over one regulatory period.1
Together with consumer price inflation (CPI),2 the aim of the X-factor is to mimic the effect of competition. The initial revenue level is set to increase annually by CPI – Xgen, thereby ensuring that gains from technological progress and changing input prices are passed on to network customers via lower prices for network services.
Xgen has previously been defined legally, at 1.25% p.a. for the first regulatory period and 1.5% p.a. for the second, with the value derived through political consensus rather than empirical analysis. From the third regulatory period onwards (2018 for gas networks and 2019 for electricity networks), however, legislation will require BNetzA to set the productivity factor using ‘state-of-the-art scientific methods’,[3] although the specific methodology is not defined. The same ordinance also allows the regulator to set separate productivity factors for electricity networks and gas networks.
How is the productivity factor defined?
Xgen is derived from the combination of differences, as follows:
- the difference between the productivity rates (total factor productivity, ΔTFP) of the network sector and the whole economy; plus
- the difference between the input price rates (ΔIP) of the whole economy and the network sector.
This is illustrated in Figure 1.
Figure 1 Xgen calculation (stylised)
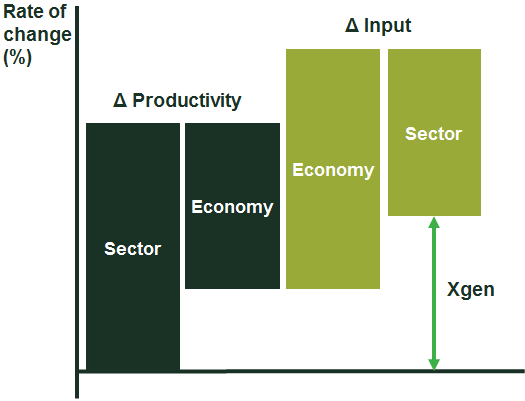
The larger the productivity differential between the network sector and the whole economy, the higher the Xgen. This implies a tougher revenue cap for the networks (one that allows them less total revenue).
Similarly, the larger the input price differential between the network sector and the whole economy, the higher the Xgen, and the tougher the revenue cap. However, if network operators’ growth of the input prices is relatively strong, the difference in input price growth may outweigh any productivity differentials. This will result in a lower Xgen and hence a more generous revenue cap (one that allows more total revenue).
Two commonly used approaches for measuring productivity growth are the Törnqvist and Malmquist methods. The relative merits of these approaches are summarised in the box. Under both methods, changes in input prices are typically calculated using simple arithmetic approaches (e.g. weighting of indices).
Why was BNetzA’s initial approach from 2006 not pursued?
The upcoming (third) regulatory period is the first time that the productivity factor will need to be estimated by BNetzA, using scientific methods—although there was an unsuccessful attempt by BNetzA to recommend a productivity factor in 2006, at the inception of the German incentive regulation regime. At that time, the regulator proposed a general productivity factor of 2.54% per year for the first regulatory period. This figure implied that the productivity growth of German energy networks would be 2.54 percentage points higher than the productivity growth of the German economy each year.
This assumption was contentious, and the German government eventually decided not to follow the regulator’s recommendation, arguing that an Xgen of 2.54% per year was too ambitious for a new regulatory regime. Instead, the government decided that, for a transitional period (from 2009 to 2018), the annual productivity factor would be 1.25% in the first regulatory period and 1.5% over the second regulatory period. These factors were defined legally, and were not based on any further empirical analysis. They applied to the gas and electricity distribution network operators (DSOs), as well as the transmission operators (TSOs).
Oxera replicated the regulator’s initial Törnqvist approach. This confirmed a number of shortcomings that had been flagged by the network industry during the 2006 consultation, including gross output measures that included intra-sector energy re-sales whose churn data inflated actual output.4 The regulator’s analysis failed to identify structural breaks in the data series, and also arbitrarily selected and weighted the time periods. In all, the regulator’s calculation of 2.54% per year overstated actual productivity development, as shown by submissions in the consultation.
Which approach did Oxera pursue?
Oxera’s study adopted the Törnqvist approach, an internationally accepted approach that is transparent due to its reliance on publicly available data.5 The study used data from 1991 to 2014 from the German statistical office, and both of the commonly used types of output measure: value added and gross output. Value added output is defined as the difference between an industry’s output and intermediate consumption. Gross output is defined as the sum of an industry’s value added and intermediate inputs.
Since more granular network sector data is not available, Oxera’s analysis was based on aggregate data for the energy sector as a whole. This data covers the whole value added chain, including electricity and gas production and distribution as well as—albeit to a much smaller extent—steam and air conditioning.
Pros and cons of the Malmquist and Törnqvist methods
An advantage of the Törnqvist calculation is that it is based on publicly available data—typically, productivity information provided by statistical offices. Such data is publicly available over a relatively long period, and updates are usually annual. This allows volatility in the data to be detected, as well as a greater depth of analysis.
The Malmquist method, on the other hand, usually relies on only a few data points—for example, German company data is available only for 2006 and 2011 for electricity operators, and for 2006 and 2010 for gas operators. The Malmquist method has the advantage that it can measure the sector’s technological change—i.e. its ‘frontier shift’, which is defined by the sector’s optimal performers. Any potential bias through a less-than-optimal performance by companies that lag behind this frontier (‘catch-up’) is thus removed. Furthermore, the Malmquist method uses actual company data rather than relying on statistical indices, which are often more aggregated.
Note: For further details on the methods, see Färe, R., Grosskopf, S., Norris, M. and Zhang, Z. (1994), ‘Productivity Growth, Technical Progress, and Efficiency Change in Industrialized Countries’, American Economic Review, 84, pp. 66–83; Ray, S.C. and Desli, E. (1997), ‘Productivity Growth, Technical Progress, and Efficiency Change in Industrialized Countries: Comment’, American Economic Review, 87, pp. 1033–39; and Törnqvist, L. (1936), ‘The Bank of Finland’s Consumption Price Index’, Bank of Finland Monthly Bulletin, 10, 1–8.
Source: Oxera.
As a result, the productivity measures are based on data for the energy supply industry as a whole, and therefore cover more than just the network industry. This also means that productivity of the electricity and gas sectors cannot be estimated separately. Input prices can be, however, and these are calculated separately for electricity and gas networks (but not for transmission versus distribution).
Using this data, Oxera’s study calculated the four Xgen terms shown in Figure 1 over various periods ranging from four years (2011–14, or growth rates over 2012–14)6 up to the maximum time period (1991–2014, or growth rates over 1992–2014).
Findings: Xgen terms
The resulting productivity differential, input price differential and Xgen are shown in Figure 2 (as upper, middle and lower charts).
The productivity differential is highly volatile, and there is no clear long-term trend. Over the longer period of 1992–2014 (data from 1991 onwards), the productivity differential is slightly positive. If the analysis starts around the year 2000, the differential is virtually zero. The shorter the period, the fewer the number of observations, and the higher the volatility.7 For example, in the shortest period, covering 2012–14, the productivity differential is 2%. Increasing this period by just one year yields -4% (using the value added method in each case).
The input price differential is usually negative, irrespective of the period considered. The input prices of the network sector grow at a higher rate than those of the whole economy. The energy network sector therefore faces more cost pressure than the economy as a whole, on average.
The Xgen is the sum of the input price and productivity differential, and is similarly volatile to the productivity differential.
Figure 2 Productivity differentials, input price differentials, and resulting Xgen
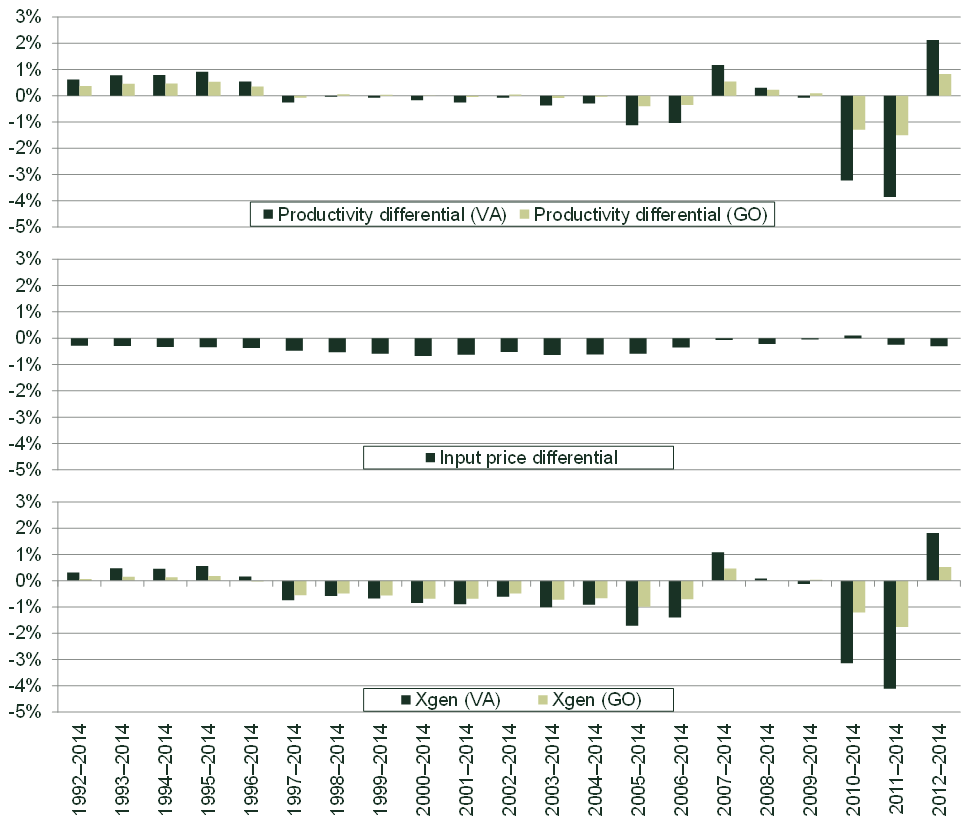
Source: Oxera.
Oxera’s results demonstrate that Xgen is not stable, and that it largely depends on the selected time period. This is due to volatile energy productivity (see Figure 2). The shorter the period, the lower the chance that yearly fluctuations—in particular in the energy industry—offset each other, and the higher the volatility of Xgen. Figure 2 also shows that Xgen is positive in about 8 out of 21 of the selected periods, and negative in 13 cases.
Given the relationship between the period’s length and its relevance for the future (e.g. number of years since liberalisation), the most robust period was found to be 1999–2014 (i.e. using data from 1998), for the following three reasons.
- Liberalisation: the German energy market was liberalised in 1998, which has promoted competition and is likely to have had an effect on productivity. Data from before 1998 is less informative in determining the scope for future productivity growth.
- Outliers: the increase in productivity in 1996 is caused, among other things, by a particularly cold winter. Using the period after 1996 avoids this outlier. While there are some other outliers in more recent years (see Oxera’s report for details),8 these are generally found on both sides, and their treatment is therefore less relevant. Furthermore, future productivity growth can be reasonably assumed to follow the more recent trend rather than previous trends.
- Structural break: Oxera identified a structural break for Xgen in 1996 using a statistical significance test.
Whether Xgen should be calculated from 1998 (liberalisation) or 1996 (outlier, structural break) is less clear; the two time periods lead to similar, and both slightly negative, values for Xgen. Oxera performed numerous sensitivity tests. Overall, based on the observation that Xgen can be negative or positive, depending on the particular cut-offs, Oxera’s analysis concluded that Xgen is more likely to be negative than positive, and generally around 0%.
Cross-checks based on productivity data from the OECD (on the whole economy) and EU KLEMS (on the whole economy and the energy industry) yield similar results to those derived using data from the German statistical office.9 This further supports the conclusion that the Xgen of the German energy networks may not be very different from 0%.
Which approach will the regulator adopt?
In December 2016, the regulator’s consultant put forward two Törnqvist and one Malmquist methodologies.10 Its report discussed the approaches conceptually, and proposed methodologies and types and sources of data. The report did not present quantitative data, either in the form of raw or adjusted data values that could be used as an underlying data input for the methodologies. Nor did it present any quantitative results of the methodologies on the basis of calculations.
The first Törnqvist methodology largely corresponds to the approach adopted by Oxera. The second Törnqvist methodology attempts to derive a composite productivity measure synthetically, based on aggregating productivity estimates from comparator sectors. These sectors include metal products manufacturing, telecommunications, repair and installation of machines and installations, and storage and services for transport.
The Malmquist method proposed by BNetzA’s consultant was based on company-specific data from the base years of the three regulatory periods for German energy networks (2006, 2010, 2011, 2015, and possibly 2016).11 No preference was expressed as to a method or combination of methods, or for the weighting of the productivity results.
Oxera found that, as the consultant’s report did not provide quantitative data or results, it was not possible to conduct a conclusive review of its methods. Any critique would require both conceptual and empirical evidence.
Conclusions
Oxera’s Törnqvist productivity calculation was based on publicly available data from 1991 to 2014. Overall, Oxera’s analysis found that Xgen is more likely to be negative than positive, and that it is likely to be close to 0%. This means that, over a longer period, the productivity and input price movements in the regulated industry are likely to be similar to the trends in the whole economy. This implies that the term CPI – Xgen becomes similar to CPI.
The regulator’s consultant put forward a suite of methodologies. One of its Törnqvist approaches largely corresponds to the methodology adopted by Oxera. In the absence of quantitative data and results in the consultant’s report, a conclusive review of the methods was not feasible.
BNetzA is expected to determine the Xgen values once the consultation on the methodologies has been completed. As of early 2017, it is unclear which method the regulator will choose, and whether BNetzA will decide to determine separate productivity factors for gas and electricity networks. A draft determination for the gas networks is expected in mid-2017. If the regulator decides to set a separate productivity factor for electricity networks, the value of this factor would then be expected to be announced in 2018. In addition to the ongoing consultation on methodology, one or more further consultations will take place on the specific quantitative determination of the Xgen values.
This article is based on Oxera (2017), ‘Bestimmung des generellen sektoralen Produktivitätsfaktors für Strom- und Gasnetzbetreiber’, Untersuchung für den BDEW Bundesverband der Energie- und Wasserwirtschaft e.V., 6 February. Oxera’s report was submitted during BNetzA’s regulatory consultation.
1 Bundesnetzagentur (2015), ‘Evaluierungsbericht nach § 33 Anreizregulierungsverordnung’, 21 January, p. 135.
2 Measured using the German consumer price index (Verbraucherpreisindex, VPI).
3 Article 9 of the Incentive Regulation Ordinance (Anreizregulierungsverordnung, AregV).
4 In addition, when using the gross output measure, the respective input measures ignored intermediate inputs.
5 A Malmquist analysis based on company-specific data was not undertaken, as the necessary data was not publicly available. See Oxera (2017), ‘Bestimmung des generellen sektoralen Produktivitätsfaktors für Strom- und Gasnetzbetreiber’, Untersuchung für den BDEW Bundesverband der Energie- und Wasserwirtschaft e.V., 6 February.
6 Four years is the minimum period under German law.
7 The productivity differential uses total factor productivity data based on the two-digit code data for the energy sector as per the Standard Industrial Classification. The input price measures suggested by BNetzA’s consultant are different.
8 Oxera (2017), ‘Bestimmung des generellen sektoralen Produktivitätsfaktors für Strom- und Gasnetzbetreiber’, Untersuchung für den BDEW Bundesverband der Energie- und Wasserwirtschaft e.V., 6 February.
9 The results are not identical, due to factors such as data revisions and different sector definitions. For example, EU KLEMS data defines the energy sector as including water supply, whereas the Statistical Office does not.
10 Wissenschaftliches Institut für Infrastruktur und Kommunikationsdienste GmbH (2016), ‘Gutachten zur Bestimmung des generellen sektoralen Produktivitätsfaktors’, Studie für die Bundesnetzagentur, 16 December.
11 After the first regulatory period, a one-year lag between gas and electricity networks was introduced.
Download

Related

PR24 redetermination: what the CMA’s decision means for UK households and water regulation
In this special edition of Top of the Agenda, we’re diving into the UK water sector to explore the Competition and Markets Authority’s (CMA) final determinations: the PR 24 Redetermination process. In England and Wales, the amount consumers pay for their water is regulated by the Office of Water Regulation… Read More

Behavioural economics: how does decision-making impact business and policy?
Behavioural economics is all around us — from competition rulings, like the Google Search ruling in the US, to EU regulations targeting online dark patterns. It affects how we combat consumer manipulation, design policy, and even understand the behaviour of music fans. In this latest episode, Helen Jenkins is joined… Read More