
RIIO-2 Final Determinations: how final?
Having published its Draft Determinations (DDs) in July 2020,1 on 8 December 2020, Ofgem published its Final Determinations (FDs) for the RIIO-2 price controls for the GB electricity transmission (ET), gas transmission (GT), and gas distribution (GD) sectors, and the electricity system operator (ESO).2 The price controls are due to start on 1 April 2021 and will run for five years, until 31 March 2026.3
Ofgem’s RIIO-2 price control review runs concurrently with the Competition and Markets Authority’s (CMA’s) redetermination of Ofwat’s PR19 price review for four disputing water companies.4 In particular, the CMA published its provisional findings (PFs) in September 2020 after Ofgem published its DDs in July 2020. In its FDs, Ofgem refers to the CMA’s PFs, however, it is unable to refer to the CMA’s final determinations, as these are not expected until February 2021. Figure 1 shows the timeline.
Figure 1 The timeline for Ofgem’s RIIO-2 determinations for ET, GT, GD sectors and the CMA’s PR19 appeals
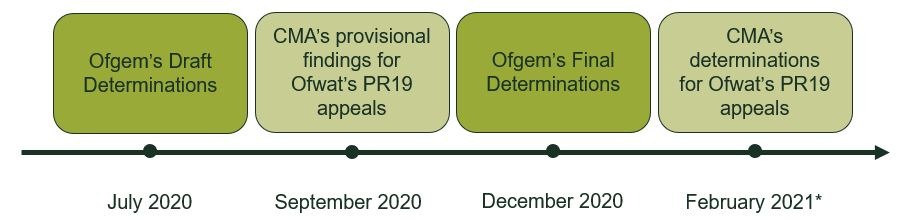
Source: Ofgem (2020), ‘RIIO-2 Draft Determinations for Transmission, Gas Distribution and Electricity System Operator’, 9 July. Ofgem (2020), ‘RIIO-2 Final Determinations for Transmission and Gas Distribution network companies and the Electricity System Operator’, 8 December. Competition and Markets Authority (2020), ‘Ofwat Price Determinations’, 19 March.
This article builds on Oxera’s review of Ofgem’s DDs, highlighting the most impactful changes. Oxera’s commentary on the CMA’s PFs and the implications of the CMA’s PR19 appeals for economic regulation provides further background information.
Ofgem’s revenue allowances in the FDs are higher than in the DDs and Ofgem considers the price control financeable. However, the allowances still represent a significant challenge to the networks’ initial business plan submissions. As the next step of the price control review (in addition to finalising all aspects of RIIO-2), Ofgem will publish the statutory consultation on licence modifications and the networks will consider whether the price control is deliverable or they see the need to appeal Ofgem’s FDs to the CMA.
RIIO-2 Final Determinations highlights
Figure 2 shows selected elements of the price controls, comparing companies’ proposals, Ofgem’s DDs and Ofgem’s FDs.
Figure 2 RIIO-2 Final Determinations highlights: comparison of companies’ proposals, Draft and Final Determinations
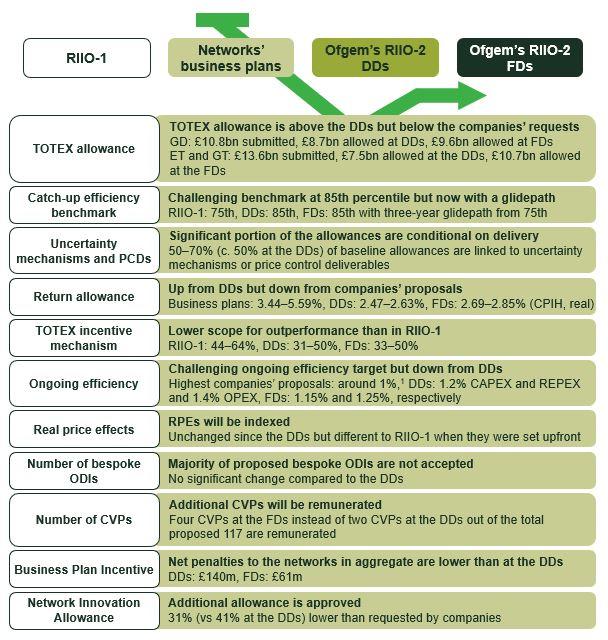
Source: Ofgem (2020), ‘RIIO-2 Draft Determinations for Transmission, Gas Distribution and Electricity System Operator’, 9 July. Ofgem (2020), ‘RIIO-2 Final Determinations for Transmission and Gas Distribution network companies and the Electricity System Operator’, 8 December.
Below, we provide an overview of the main changes in Ofgem’s FDs compared to the DDs across the key areas of RIIO-2.
Key areas of the RIIO-2 price control
Outputs
The outputs framework for RIIO-2, as previously determined,5 consists of: (i) Licence Obligations (LO) setting minimum standards; (ii) Price Control Deliverables (PCDs) specifying deliverables for the allocated funding and mechanisms for refunding consumers in the event of outputs not being delivered; and (iii) Outcome Delivery Incentives (ODIs) that drive service improvements through reputational and financial incentives.
Ofgem has now provided further clarity on the workings of PCDs. In particular, there will be:
- mechanistic PCDs that can be linked to defined volumes of work and allow recovery of non-delivered work based on unit costs;
- evaluative PCDs where the exact work is not clear and an in-depth assessment is required.
The common outputs (i.e. outputs that apply to multiple networks and sectors) that Ofgem proposed in the areas of ‘meeting the needs of consumers and network users’, ‘maintaining a safe and resilient network’, and ‘delivering an environmentally sustainable network’ at the DDs stage have largely been confirmed in the FDs. For sector-specific outputs, some tweaks have been made to specific schemes, e.g. updated unit costs for the replacement expenditure (REPEX) PCDs in the GD sector.
Additionally, Ofgem has now accepted some bespoke outputs that had previously been rejected due to insufficient evidence, but has also removed some outputs that it previously accepted in the DDs. For instance, Cadent provided additional information on its bespoke PCD to provide tailored welfare support to vulnerable consumers, which has led to Ofgem accepting the proposals. However, Cadent’s proposed community fund has been removed as an output with Ofgem still requiring the network to undertake this activity under its corporate social responsibility. Overall, it is still the case that Ofgem has not accepted the vast majority of the over 200 bespoke outputs that companies proposed.
Cost allowances
Final allowances across the sector have increased compared to what was proposed at the DDs. Overall, Ofgem set baseline total expenditure (TOTEX) allowances at £20.3bn—an increase of around 25% compared to the DDs. As previously proposed, a large proportion of baseline TOTEX is linked to uncertainty mechanisms and PCDs, where companies are only to be paid for what they deliver over the price control period. This applies to around 50% of baseline allowance for the GD sector (similar to that at the DDs) and 70% for the transmission sectors (which was around 50% at the DDs). There may also be an unspecified amount of additional expenditure approved under uncertainty mechanisms over the course of the price control.
Gas distribution
In the GD sector, Ofgem’s FDs allow around 11% less than companies’ proposed levels of expenditure. This compares to a proposed 20% reduction at the DDs. The movement of final allowances compared to the DDs is mainly driven by:
- workload volumes for REPEX, IT and capital expenditure (CAPEX) that Ofgem previously disallowed but has now accepted following further evidence provided by the networks;
- errors in Ofgem’s DDs models that have now been corrected.
In addition, there are modelling changes, with a smaller impact, in relation to Multiple Occupancy Buildings and regional factors. A very small proportion of the change is due to revised catch-up and ongoing efficiency challenges (see below).
For the catch-up efficiency challenge, Ofgem decided to retain the previously proposed benchmark at the 85th percentile. However, a three-year glidepath has now been introduced, starting with a 75th percentile benchmark, to allow less efficient companies more time to catch up. The proposed regression analysis has not changed significantly compared to the DDs. Ofgem is still using one TOTEX model with a single cost driver consisting of a composite scale variable capturing bottom-up cost drivers.
Electricity and gas transmission
In the electricity and gas transmission sectors, the networks submitted additional justifications for workloads that were previously proposed to be disallowed. This, in addition to updated data and corrected modelling errors, has led to TOTEX allowances for transmission companies that are still lower than companies’ proposals but significantly higher than at the DDs stage.
- National Grid Electricity Transmission’s (NGET’s) allowed baseline revenue at the DDs was only £3.3bn out of the £7.1bn it asked for in its business plan. At the FDs, this has increased to £5.3bn.
- The final baseline allowances for the other electricity transmission operators are around 34% (SHET) and 25% (SPT) higher than at the DDs, with the two companies now receiving close to 90% of what they requested.
- National Grid Gas Transmission’s (NGGT’s) baseline allowance increased from £1.6bn to £2.0bn, compared to £2.6bn submitted in its business plan.
Real price effects (RPEs) and frontier shift
As previously proposed, Ofgem decided to index costs for labour and materials using the same input price indices as for RIIO-1. The upfront allowance will be based on forecasts and then ‘trued up’ annually.
Ofgem slightly reduced the ongoing efficiency targets at the FDs. The ongoing efficiency target for CAPEX and REPEX is reduced from 1.2% p.a. to 1.15% p.a., and the target for operating expenditure (OPEX) decreases from 1.4% p.a. to 1.25% p.a. The reduction compared to the DDs is due to Ofgem now giving some weight to Gross Output productivity measures (following responses from many of the networks on the issue).
Allowed return on capital
Ofgem has set the allowed return on capital at 2.69‒2.85% (CPIH-real) for transmission and gas distribution networks. This is an increase of approximately 20bps for each company relative to Ofgem’s DDs, despite the yields on index-linked gilts, which drive the risk-free rate, going down.
Table 2 below shows the allowed return on capital parameters for the DDs, FDs, and the CMA’s PFs in the ongoing PR19 redeterminations.
Table 1 Allowed return on capital (CPIH, real)
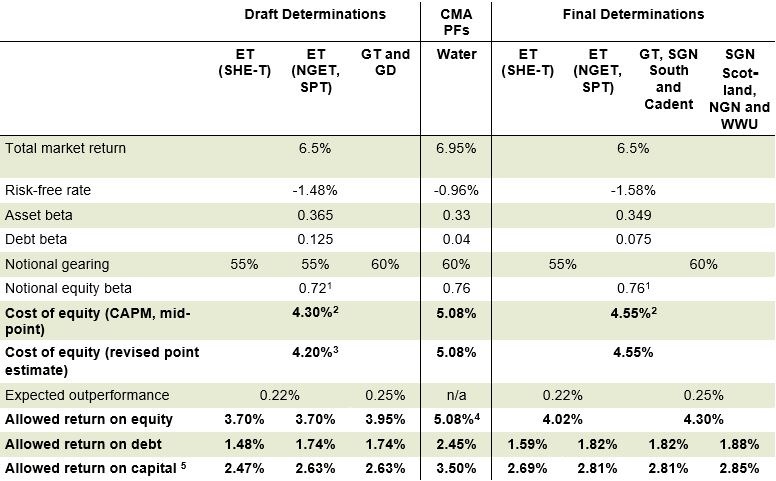
Source: Ofgem (2020), ‘RIIO-2 draft determinations – Finance Annex’, 9 July. Competition and Markets Authority (2020), ‘Anglian Water Services Limited, Bristol Water plc, Northumbrian Water Limited and Yorkshire Water Services Limited price determinations – provisional findings’, 29 September, p. 675. Ofgem (2020), ‘RIIO-2 final determinations – Finance Annex’, 8 December, p. 71.
Return on equity
Ofgem set the allowed return on equity 32‒35bps higher than in the DDs, predominantly due to an increase in the equity beta. It is, however, 78‒106bps lower than in the CMA’s provisional findings. In particular, Ofgem revises its assumptions as follows.
- Total market return—Ofgem maintains its position from the DDs with a total market return range of 6.25% to 6.75% (CPIH, real), which is lower than the CMA’s PFs and excludes the point estimate adopted by the CMA.
- Risk-free rate—Ofgem’s estimate reflects yields on 20-year index-linked gilts that are down 10bps since May 2020 (i.e. the cut-off date for the DDs). The Ofgem methodology differs from the CMA’s provisional findings, which use both index-linked gilts (for the lower bound) and AAA-rated corporate bonds (for the upper bound).
- Asset beta—in the FDs, Ofgem chose to attribute more weight to National Grid’s observed beta, which is higher than the average for the water companies considered as comparators.6
- Debt beta—Ofgem has revised its estimate to the mid-point of the CMA’s provisional range of 0.0–0.15, stating that a wide range of estimates could be appropriate.
- Expected outperformance: the adjustment to the allowed return on equity is unchanged (22‒25bps). As per the DDs, networks would receive this back if the outperformance does not materialise. However, when calculating the ex post adjustment, rather than measuring the outperformance materialised in the sector on average, Ofgem has updated its approach at the FDs to measure company-specific performance.
Ofgem’s discussion around the validity of its cross-checks is less prominent in the FDs than in the DDs. The returns implied by the six cross-checks are all lower than 5.0%, which Ofgem believes implies an upper bound on the cost of equity of 5.0%. It therefore narrows the range of the equity return implied by the CAPM down from 3.85‒5.24% to 3.8‒5.0%. Ofgem uses a point estimate of 4.55%, which is 15bps higher than the mid-point of the range implied by the cross-checks (i.e. aiming up on a range of 3.8‒5.0%). However, if the range implied by the CAPM is used, then 4.55% is the mid-point (i.e. no aiming up on a range of 3.85‒5.24%).
Return on debt
On the return on debt, Ofgem continues to index the allowance to changes in the benchmark index.
- Ofgem has not changed the benchmark index or the averaging period—it uses a 10–14-year trombone trailing average of the iBoxx GBP Utilities 10+ index.
- SHET’s cost of debt allowance remains weighted to its RAV.
- Ofgem has increased the allowance for the additional costs of borrowing from 17bps to 25bps. This reflects a higher cost of carry and additional costs related to the transition of the price control from RPI to CPIH indexation.
- The smaller networks such as SGN Scotland, NGN and WWU are granted a 6bps uplift to their cost of debt allowances, reflecting the expectation that they will issue debt in smaller amounts or less frequently.
Ofgem’s approach to index calibration is different from that applied by the CMA in the PFs. To address this, Ofgem cross-checks its cost of debt allowance following an approach that is more similar to the CMA’s and confirms that it implies a similar allowance.
TOTEX incentive mechanism (TIM)
Ofgem has kept the approach to TIM unchanged since the DDs. TOTEX outperformance or underperformance will be shared with consumers in proportion to the incentive rate, which in turn depends on the confidence that Ofgem has in the efficiency of the costs proposed by the companies.
The networks’ incentive rates have increased or decreased marginally since the DDs, with two exceptions: SPT’s and NGET’s rates have changed more significantly (by 10% up and 6% down respectively). All changes are driven by either additional costs being allowed or additional costs being classified as high-confidence costs. The range of the incentive rates across the networks remains lower than in RIIO-1: 33–50% in the RIIO-2 FDs compared to 44–64% in RIIO-1. Other things equal, lower incentive rates reduce companies’ ability to outperform (or underperform).
Business Plan Incentive (BPI)
The BPI was developed to encourage ambitious, high-quality business plans. The revised outcomes of the BPI are more favourable to the networks than at the DDs stage, ranging from a penalty of 1.2% of TOTEX (£65m penalty to NGET) to a reward of 0.9% of TOTEX (£19.5m to SHET).7
- Stage 1: NGGT and NGET are penalised for not meeting the specific quality requirements for the business plans in Ofgem’s assessment, but to a lesser degree than at the DDs stage.
- Stage 2: four instead of two customer value propositions (CVPs) at the DDs stage are rewarded. The rewards are subject to a clawback in case of non-delivery.
- Stage 3: as at the DDs stage, almost all companies incurred a penalty for poorly justified cost submissions in Ofgem’s assessment. However, the amounts are more moderate now: £60m instead of £263m at the DDs stage.8
- Stage 4: at the DDs stage, Ofgem did not find the proposed costs of any companies to be lower than its benchmark for setting the allowance and, therefore, none of them appeared to be eligible for this reward. Now, three networks have been rewarded—the change in the outcome is driven by Ofgem undertaking the assessment at a more granular (cost-category) level.
In response to submissions that highlighted an apparent bias of the BPI towards penalties, Ofgem has confirmed that it disagrees and considers the mechanism to be well-balanced.
Uncertainty mechanisms
As proposed in the DDs and previous methodologies, there are a number of uncertainty mechanisms used in RIIO-2 to manage uncertain workloads, unforeseen circumstances requiring changes to allowances and external factors beyond the control of network companies. Examples of these are discussed in the Net Zero and innovation section below. Compared to RIIO-1, significantly more focus has been placed on these uncertainty mechanisms. This also means that large proportions of allowances are linked to uncertainty mechanisms and there are additional funds that networks can apply for even within the price control period.
Net zero and innovation
Following the Decarbonisation Action Plan published in February 2020,9 in the DDs, Ofgem confirmed its intention to pursue the objective of facilitating the delivery of the UK’s net zero emissions agenda and making the price control framework as adaptive and flexible as possible. The three main schemes proposed by Ofgem in the DDs have been confirmed in the FDs: the net zero re-opener (available to the GD and transmission sectors), the Strategic Innovation Fund (SIF, also available to the ESO), as well as the Network Innovation Allowance (NIA), which has been in place since RIIO-1.
- The net zero re-opener will allow for changes to the price control allowances related to the achievement of net zero and can be triggered only by Ofgem.
- The Strategic Innovation Fund (SIF) focuses on high-value innovation projects of over £5m that would not otherwise be pursued by operators as business-as-usual activities or via the NIA funding. In the FDs, Ofgem has included a default level of companies’ compulsory contribution equal to 10% of the project costs. The proposed overall funding of £450m has been confirmed and could be expanded if necessary.
- The Network Innovation Allowance (NIA) focuses on innovative projects related to the energy system transition and provision of support to vulnerable consumers. The overall funding is of £209.4m, which is £27.6m higher than the level proposed in the DDs and covers 69% of the £303m requested by companies. Moreover, the FDs introduced a power for Ofgem to potentially increase GT and GD NIA funding for hydrogen innovation during RIIO-2.
Based on the feedback received during the consultation, particularly on the limited scope for funding for early development work and for very small net zero facilitation projects, Ofgem included two additional schemes:
- the ‘net zero and re-opener development use-it-or-lose-it (UIOLI) allowance’, with an overall value of £88.1m, available to ET, GT and GD networks;
- the ‘net zero pre-construction and small projects re-opener’, applied to GD and GT networks.
Competition
Ofgem intends to seek greater reliance on competition in the delivery of large separable projects, for the benefit of consumers. At this stage, no projects suitable for competition have been identified. Going forward, Ofgem will assess projects for their suitability for early or late forms of competition.
- Early competition refers to the competition run prior to the project design process to reveal the best idea to meet a system need. The ESO is currently developing and consulting on the framework and is expected to deliver the Early Competition Plan in April 2021.
- Late competition refers to the application of a separate regime to new, separable and high-value projects. Ofgem will consider all projects that are brought forward under an uncertainty mechanism (as opposed to the projects funded in baseline allowances) for potential delivery through a late competition model.
Neither of the competition schemes applies to projects funded in baseline allowances.
1 Ofgem (2020), ‘RIIO-2 Draft Determinations for Transmission, Gas Distribution and Electricity System Operator’, 9 July.
2 Ofgem (2020), ‘RIIO-2 Final Determinations for Transmission and Gas Distribution network companies and the Electricity System Operator’, 8 December. The RIIO-ED2 price control for electricity distribution begins two years after the other controls. Ofgem’s next major publication on RIIO-ED2 is the sector-specific methodology decision, which is expected in December 2020. See Ofgem (2020), ‘RIIO-ED2 Methodology Consultation: Overview’, Table 1.
3 The current ESO’s Business Plan is set for two years within the RIIO-2 period from 1 April 2021 to 31 March 2023.
4 Competition and Markets Authority (2020), ‘Ofwat Price Determinations’, 19 March.
5 Ofgem (2019), ‘RIIO-2 Sector Specific Methodology – Core document’, 24 May, section 4.
6 Includes NG, PNN, SVT and UU but not SSE.
7 Oxera’s calculation, based on data reported by Ofgem.
8 The penalty amounted to 10% of the poorly justified costs. Oxera’s calculation, based on data reported by Ofgem.
9 Ofgem (2020), ‘Ofgem decarbonisation action plan’, February.
Download
Contact

Jostein Kristensen
Senior AdviserContributors
Related
Download
Related

Modernising EU competition policy: from guidelines to outcomes
This special edition of Top of the Agenda was recorded at our 2026 Brussels conference, which hosted senior figures from the European Commission, national competition authorities, academics and the legal community to discuss one of the most significant developments in EU competition policy in two decades: the revision of… Read More

When does a discount become deceptive? An economic framework for the regulation of reference pricing
The use of ‘reference’ pricing—where a previous (or future) ‘was’ price is displayed alongside the current ‘now’ price to indicate a discount for customers—is a common feature across digital and physical markets. In supermarkets, retailers commonly advertise a headline Recommended Retail Price (RRP), or ‘was’ price, alongside the current… Read More