
Rethinking HS2
On 4 October 2023, Prime Minister Rishi Sunak confirmed that Phase 2 of High Speed Two (HS2) would not go ahead.1 Was this the right call? How do we make the most of where we are now? To answer these questions, we need to understand why HS2 was first proposed, and how circumstances have changed.
Rethinking HS2: how the pandemic, costs, and cuts are reshaping the business case
HS2 was conceived to increase capacity along the West Coast Main Line (WCML), and to a lesser extent, the East Coast Main Line (ECML). By taking inter-city services off existing lines, HS2 would free up space on them to allow more commuter and freight services, improving connectivity, reliability and crowding on services.2
This strategic rationale was put forward over a decade ago. Has COVID-19 changed the need for HS2? Passenger numbers have recovered at different speeds in different parts of the rail network, so it is important to look at the right part of the rail network when thinking about rail demand for HS2.
The evidence suggests that demand is still well below the levels seen in 2019. Avanti West Coast, which serves the WCML, served only 66% of passenger kilometres in the first quarter of 2023 compared with the same period in 2019 (see Figure 1 below). While it is possible that demand returns to levels that justify the need for HS2, the latest evidence suggests that there may be fewer passengers on HS2 than previously expected.
Figure 1 Passenger demand on Avanti West Coast (percentage of 2019 levels)
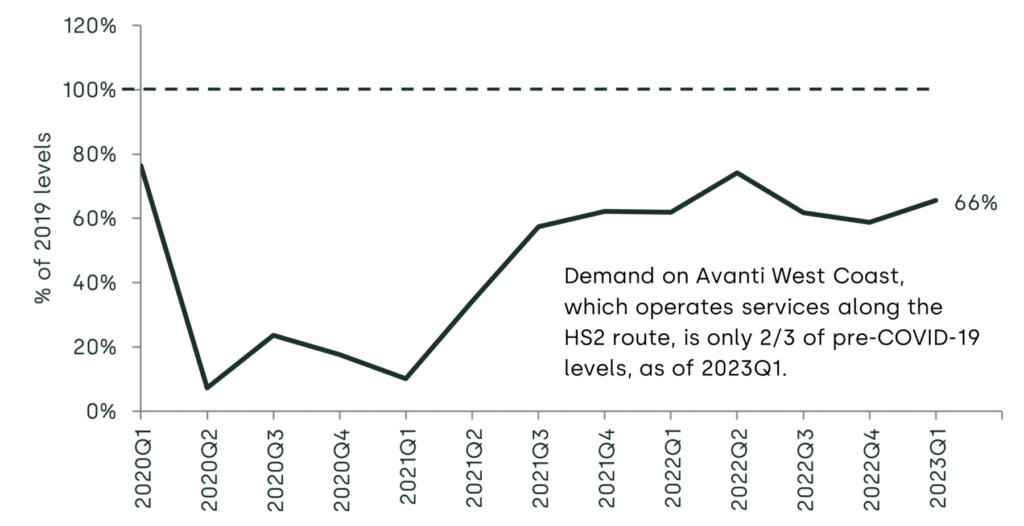
Source: Oxera analysis of ORR data (2023), ‘Table 1223 – passenger journeys by operator’, https://shorturl.at/kHR79 (accessed 18 October 2023).
Not only has demand been slow to return, there is a two-track recovery in the type of journeys that people are making. While rail travel for leisure has bounced back to near 2019 levels (as of 2022, the latest publicly available data), business demand is significantly below 2019 levels, as shown in Figure 2 below.
This is an important point. HS2 derives most of its benefits—around 70%3—from business travel through reduced travel times, less crowding and greater reliability. Lower-than-expected demand from passengers travelling for business purposes—who tend to pay the highest fares—would therefore weaken the strategic rationale for HS2, and limit revenues from operating trains on the line.
In addition, HS2 is unlikely to meet other strategic needs. One is the claim that HS2 will reduce carbon emissions.4 However, the Oakervee Review (which looked at ‘whether and how’ to proceed with HS2)5 found that it was unclear whether HS2 is carbon positive or negative, taking into account both construction and operational emissions.6
Another claim is that it will address regional disparities (‘levelling up’, as described by the UK government).7 The UK economy is heavily weighted towards London as the most productive region, with other regions lagging behind. The UK Government intends to remedy this by encouraging high productivity jobs to move from London to other regions, and improving connectivity in the Midlands and the North.8 But HS2’s own figures show that around 40% of all benefits (for both Phases 1 and 2) will flow to London—the biggest beneficiary of HS2 is by far the London region.9
Meanwhile, the estimated costs for HS2 are ever-increasing (and the impact of this on the economic case is discussed further below). Most recently, the cost of the London–Birmingham increased by a fifth from £45bn to £54bn in 2019 prices (and £68bn in 2023 prices).10 This raises the question: is HS2 worth taxpayers’ money?
Figure 2 Commuting, business and leisure demand for surface rail in 2022 (percentage of 2019 levels)
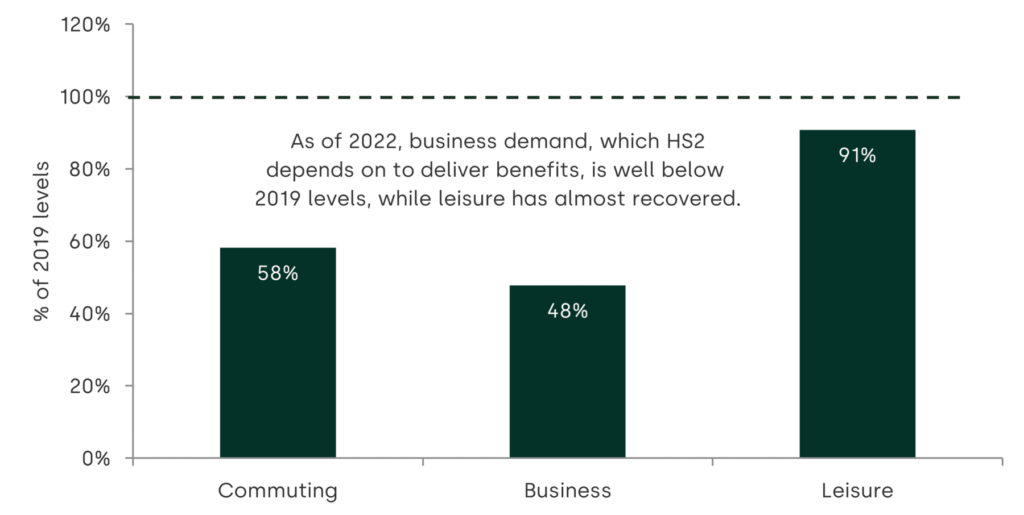
Source: Oxera analysis of National Travel Survey (NTS0409) data.
The strategic and the economic case: a growing divide
How have these changing circumstances affected the economic case for HS2? The economic case looks at how the economic benefits of HS2 compare to its costs. This is measured by the benefit–cost ratio (BCR). For example, a BCR of more than one means that the benefits exceed the costs.
The Department for Transport’s (DfT) most recent estimates of the BCR range for Phase 1 is 1.2–1.8,11 which represents low to medium value for money according to the DfT’s value for money framework.12 By comparison, the DfT has typically only approved transport schemes with high value for money (a BCR of at least two)—this accounted for 76% of approved spending between 2015 and 2019.13
However, a particularly revealing comparison is how the BCR has changed over time. In April 2020, the BCR range for Phase 1 was 0.7–1.8—therefore, it appears that the BCR for Phase 1 has improved over time. But how can this be? If costs have risen over time, and COVID-19 has affected the strategic case for HS1, we would expect the BCR to worsen, rather than improve.
This reveals much about how economic cases are done. One reason for the difference is that the amount that has already been spent (known as sunk costs)—a significant sum of £22.5bn (2019 prices) as of June 202314—is excluded from the most recent estimates. This makes sense from the perspective that this is already ‘spilled milk’, and should not affect how we make decisions moving forward.15 But this also leads to perverse incentives. It makes it possible to push through projects with poor value for money on the basis that so much has already been spent, but this approach to appraisal will ultimately be costly for the taxpayer in the long-run. Indeed, Dame Bernadette Kelly (the most senior civil servant at the DfT, and the responsible Accounting Officer for HS2) revealed that if the full costs of HS2 Phase 1 are considered, the BCR range would be significantly below one, and would represent poor value for money.16
It also reveals a more fundamental issue with economic cases. The strategic case for HS2 Phase 1 was always to enable Phase 2 to be constructed, rather than as a standalone scheme.17 Furthermore, as set out above, other strategic reasons for HS2 have weakened over time. Therefore, how is it possible that HS2 remains a good way to spend taxpayers’ funds?
The answer is that there is a fundamental disconnect between the strategic and the economic case. As Andrew Meaney, Oxera Partner, argued in a recent paper, benefits in the economic cases are not driven by the outcomes described in the strategic case. Instead, they are proxied using travel-time savings. The economic case therefore does not capture whether HS2 is able to meet its objectives.18
Weighing the scales: the costs and benefits of HS2
The disconnect between the strategic and the economic case is exacerbated by the fact that the effects of COVID-19 have not been accounted for in the UK government’s economic analysis.19 In its official business cases, the central estimate for HS2’s BCR is 1.2 for Phase 1 (London–Birmingham),20 and 1.1 when Phases 2a and 2b (to Manchester) are included.21 If wider economic impacts, which capture a range of wider (but less certain) benefits are excluded, the BCR is reduced to 0.9 (see Figure 3 below).
Figure 3 The BCR of HS2, with COVID-19 impacts and alternative cost estimates
Note: The BCR in the UK Government’s ‘central costs, no COVID effects’ scenario refers to the figures in the 2020 full business case for Phase 1. The next scenario based on the latest costs refers to the latest £54bn costs for HS2 Phase 1. The independent cost estimates are by Michael Byng, as described in the paragraphs below.
Source: Oxera analysis.
However, these do not factor in the effects of COVID-19,22 and do not take into account the UK government’s latest costs of £54bn for Phase 1.23 Adjusting for these factors, the BCR including wider impacts falls to 0.7 for Phase 1 and the overall scheme (0.6 and 0.5 for Phase 1 and the overall scheme excluding wider impacts)—the costs exceed the benefits.
Independent cost estimates by Michael Byng, who provided cost estimates for the Lord Tony Berkeley’s dissenting report to the Oakervee Review, suggest that HS2 could cost around £182bn. Using these estimates, the BCR, including wider impacts, falls to around 0.4 (0.3 excluding wider impacts). When combined with the effects of COVID-19, the BCR could be as low as 0.2, well within the ‘poor’ value for money category.
Overall, our analysis suggests that HS2’s BCR is well below the threshold at which the DfT would typically approve spending, with a high risk that the costs of both Phases 1 and 2 of HS2 exceed its benefits.
Table 2 Independent HS2 capital costs, 2023 Q2 prices

Source: Lord Tony Berkeley and Michael Byng.
What next?
Our analysis suggests that there are good reasons to cancel Phase 2 of HS2. However, the country also needs more transport investment, and the budget flexibility afforded by the cancellation of Phase 2 is an important opportunity. How do we make the most of this?
Well-articulated business cases are required for each of the new Network North investments, announced to use the funding freed up by Phase 2 of HS2 being cancelled. We need a genuine debate on the strategic needs that should be met and the projects that should be taken forward. We also need business cases that quantify benefits in a way that is linked to the strategic case. This is more difficult than the current approach, but it will also allow us to make better decisions.
It is important that we learn from HS2. A key lesson from the 2006 Eddington Review is particularly relevant: the review found that a set of smaller interventions can often have a much greater overall cumulative impact than large, ‘showpiece’ schemes.24 Equally, the value of each element of a large project should be understood. The overall impact of many small decisions in concert can deliver much better value for money for the tax payer than a single major project.
1 New Civil Engineer (2023), ‘Sunak confirms cancellation of northern leg of HS2 and Euston management change’, 4 October, https://www.newcivilengineer.com/latest/sunak-confirms-cancellation-of-northern-leg-of-hs2-and-euston-management-change-04-10-2023/ (accessed 18 October 2023).
2 Department for Transport (2017), ‘High Speed Two. Phase Two strategic case’, pp. 6–7 and section 3.
3 HS2 Ltd (2013), ‘The strategic case for HS2’, Figure 5.7. These are the most recently available estimates we are aware of that split out the benefits for business passengers. For the full network, as of October 2013, transport benefits for business passengers accounted for £41bn in benefits in 2011 prices, compared with £58bn in net transport benefits. 41/58 = 70%.
4 Department for Transport (2020), ‘Full business case. High Speed Two Phase One’, April, executive summary, para. 1.
5 Department for Transport and HS2 Ltd (2020), ‘Oakervee Review’, https://www.gov.uk/government/publications/oakervee-review-of-hs2 (accessed 20 October 2023).
6 Department for Transport and HS2 Ltd (2020), ‘Oakervee Review’, para. 5.37.
7 Department for Transport (2020), ‘Full business case. High Speed Two Phase One’, April, executive summary, para. 1.52.
8 Department for Transport (2020), ‘Full business case. High Speed Two Phase One’, April, executive summary, para. 1.58.
9 HS2 Ltd. (2017), ‘High Speed Two (HS2) Phase Two. Economic case advice for the Department for Transport’, Appendix 5, https://shorturl.at/cefAZ (accessed 18 October 2023).
10 Financial Times (2023), ‘Cost of London-to-Birmingham leg of HS2 jumps by a fifth to £54bn’, 12 October, https://www.ft.com/content/34355227-b73f-4d27-9ba9-9b2a05a9355b (accessed 18 October 2023); Kelly, B. (2023), ‘Accounting officer assessment of decision to complete phase 1 of HS2’, 4 October 2023.
11 Department for Transport (2023), ‘Continuing investment in HS2 Phase 1: accounting officer assessment (October 2023)’, 5 October.
12 Department for Transport (2015), ‘Value for Money framework’, para. 5.7, https://assets.publishing.service.gov.uk/media/5f6237408fa8f5106d15640c/value-for-money-framework.pdf (accessed 18 October 2023).
13 Department for Transport (2022), ‘Value for money indicator 2019’, 19 December, Table 3, https://shorturl.at/denD6 (accessed 27/9/2023).
14 Department for Transport and HS2 Ltd (2023), ‘HS2 6-monthly report to Parliament: June 2023’, the ‘Affordability’ section, https://shorturl.at/osKU4 (accessed 18/10/2023).
15 Excluding sunk costs is also in line with Green Book guidance. HM Treasury (2022), ‘The Green Book’, para. 5.17.
16 Kelly, B. (2023), ‘Accounting officer assessment of decision to complete phase 1 of HS2’, 4 October 2023.
17 Department for Transport (2020), ‘Full business case. High Speed Two Phase One’, April, para. 7.
18 Meaney, A. (2022), ‘Appraisal: the curse of numbers (and how to break it)’, Proceedings of the European Transport Conference. See this LinkedIn post for a summary of the paper: https://www.linkedin.com/pulse/breaking-curse-numbers-andrew-meaney/.
19 The Full Business Case for Phase 1 was published in April 2020, before the effects of the pandemic were clear, and the case for Phase 2b in 2022, where the effect of COVID-19 was presented as a sensitivity.
20 Department for Transport (2020), ‘Full business case. High Speed Two Phase One’, April, Table 2.3.
21 Department for Transport (2022), ‘HS2 Phase 2b Western Leg Crewe – Manchester. Supplement to the update on the SOBC’, Table A2, https://shorturl.at/lowGM (accessed 27/09/2023).
22 We have taken an average of the COVID-19 effects of the low and medium scenario low- and medium-level scenarios in the DfT’s analysis. This equates to a c. 15% reduction in commuting and business travel, and a c. 13% reduction in leisure travel. Department for Transport (2022), ‘HS2 Phase 2b Western Leg: Crewe to Manchester. An update on the Strategic Outline Business Case’, January, Figure 2.8.
23 Kelly, B. (2023), ‘Accounting officer assessment of decision to complete phase 1 of HS2’, 4 October 2023. We note that these ‘costs to go’ appear to exclude contingency, which would suggest that our analysis is conservative, as the costs used in economic cases should include contingency. See Department for Transport (2020), ‘Full business case. High Speed Two Phase One’, April, para. 3.27.
24 Docherty, I., and Macie, P. (2010), ‘Planning for transport in the wake of Stern and Eddington’, Regional Studies, 44(8). pp. 1085-1096, http://eprints.gla.ac.uk/43915/ (accessed 27/09/2023).

Related

Modernising EU competition policy: from guidelines to outcomes
This special edition of Top of the Agenda was recorded at our 2026 Brussels conference, which hosted senior figures from the European Commission, national competition authorities, academics and the legal community to discuss one of the most significant developments in EU competition policy in two decades: the revision of… Read More

When does a discount become deceptive? An economic framework for the regulation of reference pricing
The use of ‘reference’ pricing—where a previous (or future) ‘was’ price is displayed alongside the current ‘now’ price to indicate a discount for customers—is a common feature across digital and physical markets. In supermarkets, retailers commonly advertise a headline Recommended Retail Price (RRP), or ‘was’ price, alongside the current… Read More