
How will COVID-19 affect reform of the energy retail sector in Great Britain?
The energy sector across Europe faced a shock as lockdowns of varying severity were established in response to the COVID-19 pandemic. These shocks were mainly caused by the sudden reductions in mobility and productivity caused by the mandated temporarily closure of economies across the continent.
Electricity market data collected during April and May 2020 shows that the total demand for electricity has fallen by around one fifth in countries with stricter lockdown measures.1 While domestic demand has increased as a result of the lockdown, industrial demand has plummeted, outweighing the former effect.
Figure 1 Combined industrial and domestic electricity demand in response to lockdown restrictions
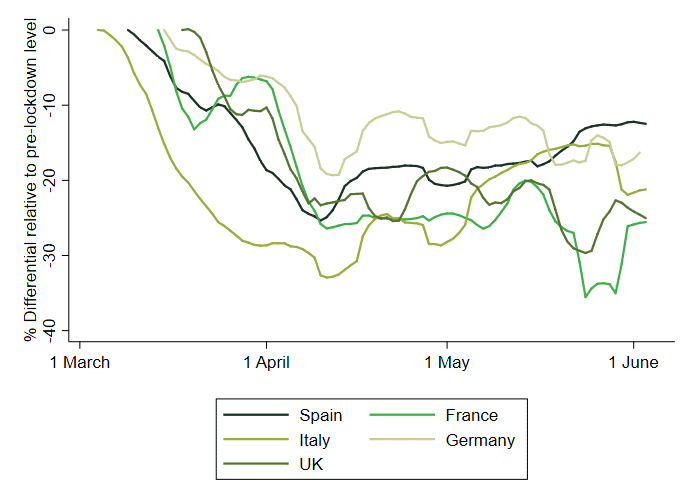
Source: Oxera analysis based on data accessed via the ENTSO-E Transparency Platform for France, Italy, Spain and the UK; Bundesnetzagentur, SMARD.de for Germany.
The fluctuating demand, in combination with available electricity supply, has caused significant variation in in wholesale electricity prices. Figure 2 shows the resulting drop in electricity prices across Europe in response to the demand shocks.
Figure 2 Electricity day-ahead prices in response to lockdown restrictions
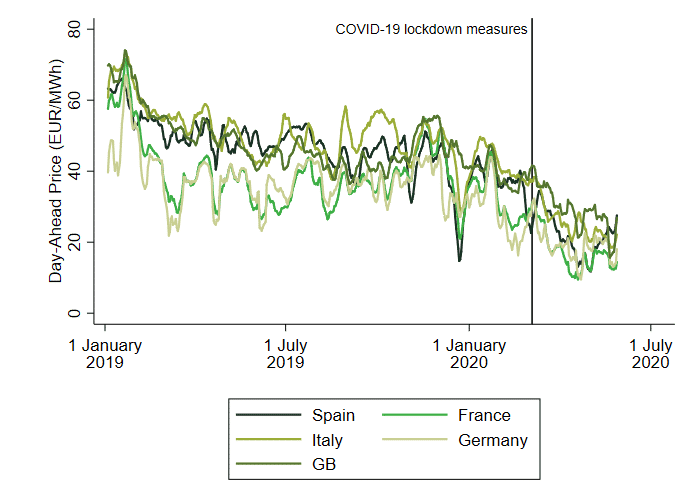
Source: Oxera analysis based on data accessed via the ENTSO-E Transparency Platform for France, Germany, Italy, Spain and Great Britain.
These recent record lows in electricity demand and price drops have also impacted the electricity generation mix (the split of generation across various types of energy sources). As in other markets, suppliers that can offer a product for a cheaper price can often sell more of it, and more readily. While the wholesale electricity market is complex, it holds that generators of electricity with lower operational costs are usually the first in line to feed electricity into the grid. At times of lower demand, electricity demand is largely met by these ‘cheaper’ generators. In practice, these generators are often wind and solar.
Figure 3 shows the energy mix across various European countries. It shows that energy sources have been affected asymmetrically as a result of the COVID-19 shocks. While the share of renewables has increased, coal, gas and other combustibles provide a lower proportion of the electricity generation mix. Meanwhile, nuclear seems to have been unaffected.
Figure 3 Changes to the electricity generation mix in response to lockdown restrictions
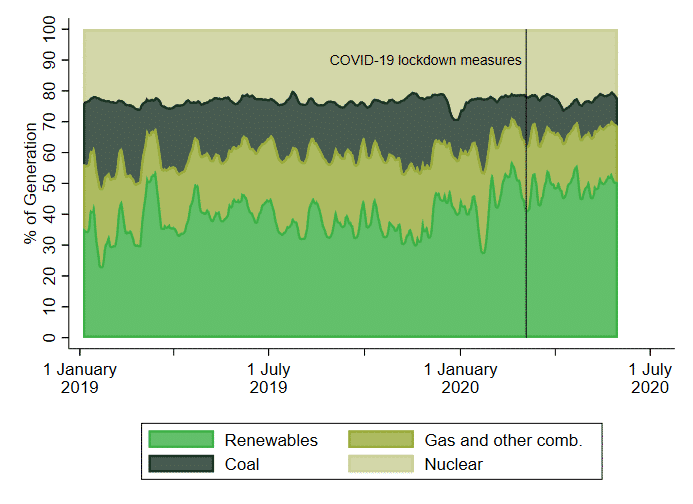
Source: Oxera analysis based on data accessed via the ENTSO-E Transparency Platform for France, Italy, Spain and the UK; Bundesnetzagentur, SMARD.de for Germany.
Following the implementation of the lockdown measures, the electricity mix across Europe has shifted towards renewable sources.2 As renewable energy sources produce electricity very cheaply once facilities are built, they are called on first to meet demand,3 pushing gas and coal plants further down the queue.4 At times of low demand, conventional electricity producers are therefore required less frequently. This effect was notable in Great Britain; on 10 May, the energy market recoded a full month of coal-free power generation for the first time.5
How does the COVID-19 crisis interfere with retail regulatory processes in place in Great Britain?
While energy demand is dropping significantly,6 more private and business customers are falling behind on paying their bills. Although there is limited public data available from the lockdown period, anecdotal evidence confirms that ‘delinquency rates’ among business customers are soaring.7 Energy suppliers have agreed to reassess, pause or reduce debt repayments and bill payments where needed.8 This has put energy suppliers in distress, especially as many of them were already operating with low profit margins.9
For example, in an open letter to energy suppliers, Ofgem quickly clarified that it supports suppliers’ responses to the disruption caused by COVID-19. In particular, Ofgem states that it would be ‘pragmatic in [its] approach to compliance during this period’, focusing on compliance with the prioritised objectives, including meeting consumers’ needs and providing a secure and reliable supply of energy.10
This comes at a time when Ofgem was also planning to reassess the default tariff caps for energy retail consumers. The caps were introduced to protect consumers following the UK Competition and Markets Authority’s (CMA’s) first review of competition in the British energy market in 2014, which revealed unsatisfactory levels of competition. The caps came into force in January 2019 and will remain in place until at least the end of 2020. The government will need to decide by 31 October 2020 whether to extend the cap beyond 2020.
Ofgem supports this process by monitoring the energy market closely while the default tariff caps are in place. Ofgem’s review of the competitiveness of the energy market for 2020 will need to be published by 31 August 2020 and needs to include a recommendation on whether the cap should remain in place for 2021 or be removed.11 This review will guide the Secretary of State’s imminent decision on the continuation or discontinuation of the default tariff caps. Ultimately, whether the default tariff caps are continued or not will depend on Ofgem’s assessment of the current state of competition and market concentration amidst the COVID-19 disruption.
Below, we review data from before and during the lockdown period to understand how COVID-19 has affected and continues to affect competition and market concentration in the British electricity retail market. Two of the metrics that Ofgem uses to monitor the state of competition in the retail energy market are market concentration and switching rates.
Retail market concentration
The number of licensed energy suppliers is an indicator of the degree of competition in the market. Ofgem monitors this number to understand the dynamics of market concentration over time, as new participants enter and some existing firms exit the market.12
We have already seen a large number of suppliers exit the British energy supply market in 2019, and trading conditions in 2020 have become more challenging as lockdown measures have been implemented. We review the most recent data on active energy suppliers in Great Britain in Figure 4.
Figure 4 Active licensed energy suppliers in Great Britain
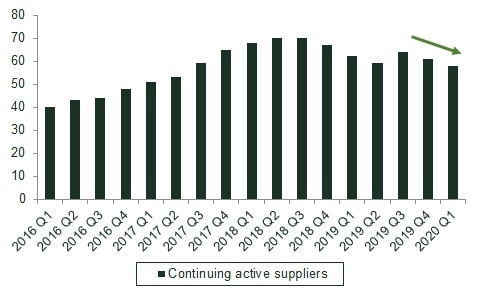
Source: Oxera analysis; Ofgem (2020) ‘Retail Market Indicators’.
Figure 4 shows a downward trend in the number of licensed energy suppliers from 2019 onwards. There have also been further exits in the energy retail market between January 2020 and March 2020 that are not yet reflected in the data.13
In addition, some smaller, local-authority-owned energy suppliers seem to have been struggling lately. For example, Bristol City Council announced on 4 June that it was selling off Bristol Energy as the supplier was facing ’unprecedented challenges’. Meanwhile, Robin Hood Energy, owned by Nottingham City Council, has appointed strategic advisors as it is struggling financially.14 Meanwhile, OVO Energy—which recently acquired SSE’s retail division and is thus Britain’s second-largest energy supplier—has announced that the lockdown has forced it to accelerate cost-cutting plans involving 2,600 redundancies.15
In response, Ofgem has recently announced a payment-deferral mechanism worth £350m for struggling energy suppliers.16 While this initiative might delay imminent exits from the energy retail market, we consider that the overall outlook for energy suppliers is challenging. It seems possible that some weaker competitors could be forced out of the market (if not now, then during the aftermath of the lockdown measures), potentially reducing the total number of licensed energy suppliers competing in the retail market.
Switching rates in the retail market
Another metric regularly used by Ofgem to assess the degree of competitiveness in the energy market is the switching rate. While this is a partial indicator for competitiveness in the retail market, we consider that a competitive market delivering quality service to consumers would not necessarily exhibit high switching rates.
Ofgem reviews trends in external switching (between suppliers) to understand levels of consumer engagement. Higher consumer engagement is considered to be beneficial as it can put pressure on energy suppliers to provide better services at competitive prices. The most recent figures on switching rates for Great Britain are available for May 2020; both April and May capture a full month of the lockdown.
Figure 5 Monthly switching figures in April and May, 2016–20
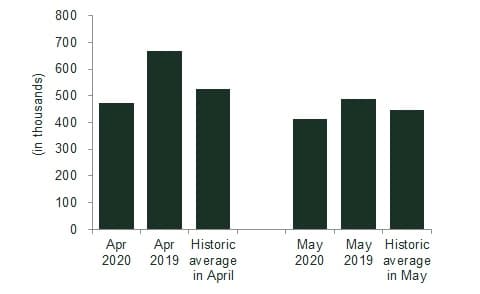
Source: Oxera analysis of Ofgem (2020), ‘Retail Market Indicators’; Energy UK (2020), ‘Energy Switching figures – April 2020’.
Figure 5 compares recent switching figures for April 2020 against those for the same month in previous years. The latest switching figures for April 2020 indicate an approximately 30% decrease compared to the previous year. However, April 2019 saw exceptional switching rates due to the price cap rise announced by Ofgem in early 2019.17 Therefore, we consider the switching rates of April 2020 in the context of the past five years. This provides a different picture; the recent figures seem to be in line with previous years.
These statistics suggest that consumers continue to assess and compare their energy suppliers. This might even be amplified in the upcoming months for various reasons; some consumers might use extra time they have while at home to consider switching, while increased energy use might motivate others to seek ways of saving on energy bills at a time when the economic outlook is uncertain. However, established energy suppliers might be perceived as a safer choice to switch to or remain with, especially as some smaller suppliers are struggling to continue operating. Such a development might reinforce higher market concentration for the ‘Big Six’ energy suppliers.18
Conclusion
Overall, we consider that COVID-19 might reverse the recent uptick in licensed energy suppliers, in line with trends appearing in late 2019, which could potentially result in a more concentrated retail electricity market. However, a likely increase in consumers’ willingness to shop around for more convenient offers might counter some of these developments and increase competition between existing suppliers.19 Meanwhile, a growing share of consumers is likely to be considered vulnerable and will require an affordable energy supply. Taken as a whole, these factors suggest that it seems likely that the default tariff cap will remain in place in some form in 2021 to ensure that energy markets are working in the interest of consumers.
1 Clair, E. (2020), ‘Looking at Covid-19 crisis from the EU electricity wholesale market’, European University Institute, April, https://fsr.eui.eu/looking-at-COVID-19-crisis-from-the-eu-electricity-wholesale-market/.
2 IEA (2020), ‘Covid-19 impact on electricity’, May, accessed 3 June 2020.
3 In some instances this is also encouraged through regulated priority access to the grid for renewables.
4 Thomas, N. (2020), ‘Lower electricity use in lockdown leads to problems for National Grid’, 11 May.
5 Lempriere, M. (2020), ‘Britain hits coal-free month milestone as demand remains low’, Current+, 11 May.
6 Business energy demand has dropped 38% on average since COVID-19 lockdowns began, according to Eon. Coyne, B. (2020), ‘Eon: Lockdown sees business energy demand fall 38 per cent’, Energyst, 29 April.
7 Clowes, E. (2020), ‘Energy suppliers call for state bailout: ‘Without help, we’re powering towards a bloodbath’’, The Telegraph, 25 May.
8 BBC News (2020), ‘Coronavirus: Energy bill help for vulnerable amid outbreak’, 20 March.
9 Thomas, N. (2020) ‘UK regulator launches £350m ‘handout’ for weaker energy suppliers‘, The Financial Times, 2 June.
10 Ofgem (2020), ‘Impact of COVID-19 on retail energy supply companies – an enabling framework for regulatory flexibility’, 8 April.
11 Ofgem (2019), ‘Developing a framework for assessing whether conditions are in place for effective competition in domestic supply contracts’, 29 May.
12 Ofgem (2020), ‘Number of active domestic suppliers by fuel type (GB)’, accessed 15 June.
13 Ofgem (2020), ‘Revocation notices’, accessed 17 June; Bairstow, J. (2020), ‘Gnergy Ltd goes bust’, Energy Live News, 18 March.
14 Lempriere, M. (2020), ‘Robin Hood becomes the second council owned supplier to seek advisors’, Current+, 7 May; Grundy, A. (2020), ‘Bristol Energy up for sale as success ‘impossible in such a volatile market’, Current+, 4 June.
15 Fraser, D. (2020), ‘Ovo Energy to close offices and cut 2,600 jobs’. BBC News, 19 May.
16 Ofgem will allow weaker energy suppliers that lack an investment-grade credit rating and find it harder to raise finance elsewhere to defer payments that they must make to network operators such as SSE, ScottishPower and Northern Powergrid. See Thomas, N. (2020), ‘UK regulator launches £350m ‘handout’ for weaker energy suppliers’, The Financial Times, 2 June.
17 Energy UK (2019), ‘Electricity Switching – April 2019’, 19 April.
18 The ‘Big Six’ are British Gas, EDF Energy, E.ON, Npower, Scottish Power, and SSE.
19 Moreover, despite some slowdown due to short-term reduction in activities, Ofgem is still expecting suppliers to deliver the smart meter roll-out by the end of 2020. Smart meters may improve customer engagement by providing real-time data and improving the accuracy of billing activities, which could lead to greater competition. See Ofgem (2020), ‘Ofgem information for energy licensees on coronavirus (COVID-19) response’, 16 April; Competition and Markets Authority (2016), ‘Energy market investigation’, 24 June, p. 49.
Download

Related

No water, no growth: tackling inefficient business water demand
Water is not typically thought of as a constraint on economic growth in England. Yet that is precisely what it is becoming. Commercial growth and new developments are being turned away because there is insufficient water to serve them. Some water companies are already exercising their powers to refuse… Read More

The energy trilemma in focus: the price of dependence
Europe’s approach to energy policy has been in transition since the 2022 energy crisis laid bare the continent’s dependence on imported fossil fuels. More recently, the outbreak of war in the Middle East and the subsequent disruption to global oil and gas markets have caused further challenges. This article… Read More