
Deep impact: assessing wider economic impacts in transport appraisal
Wider economic impacts (WEIs) in transport demonstrate the additional benefits to the economy from particular projects, and form part of an assessment of the total value for money provided by new transport schemes. While estimating WEIs is important, various approaches are available and estimation is not always straightforward. What are the different methodologies that can be used to quantify these effects, and what are their relative advantages and disadvantages?
Quantifying the WEIs of a new transport project has become increasingly important. For example, recent cuts in public expenditure in the UK have intensified the need for transport projects to produce stronger business cases in the face of greater competition for funding. WEIs, which are not always included in traditional appraisals, can be used to highlight the additional benefits to the economy, and value for money, from particular transport projects.
In the UK and Europe, the WEIs of transport schemes have already been used to demonstrate additional benefits. A 2011 survey of appraisals found that including WEIs added an average of 25% to the total benefits of a given scheme—with a range of 5–56%.1 A specific example—the Northern Line Extension (NLE)—is discussed in the box below.
What are wider economic impacts?
In the context of transport appraisal, a WEI is defined as the impact of a change in the transport network that is additional to the user benefits or, in other words, an induced effect that influences economic performance. For example, reducing the travel time of a ‘leisure’ passenger does not increase labour supply or productivity, although it does benefit that passenger. Benefits such as improvements in journey time for leisure passengers may be valued elsewhere in appraisals.
WEIs arise due to markets being imperfect and the existence of market failures, which imply that the total effects on welfare differ from the user benefits alone. Therefore, WEIs are additional to all of the benefits that accrue to users and providers of the transport network, and benefit the economy as a whole. These effects and some user benefits enable greater long-term economic output and growth, which can be interpreted as medium-/long-term spillover benefits from the transport sector to other industries and to the overall economy.
The analysis of WEIs generally considers the change to long-run levels of employment and productivity in the economy, rather than short-term effects.
Figure 1 illustrates how WEIs fit into a transport appraisal.
Figure 1 WEIs and transport appraisal

Source: Oxera.
Figure 1 provides an example of how the benefits and costs of a transport scheme are combined to give the BCR, which in turn gives an indication of a project’s value for money. The WEI of the project can be added to the benefits, which will generate a new BCR. The BCR with the WEI included will be higher than the BCR without, assuming that the WEI of the scheme is positive.
Figure 2 illustrates the mechanisms through which transport enhances the productive capacity of the wider economy.
Figure 2 Wider economic impacts of transport
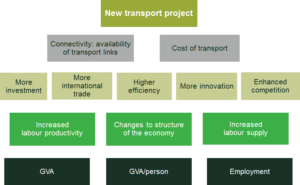
Source: Oxera.
These mechanisms are classified as follows.
- Drivers of performance (second row). These are the means by which changes to the transport system, such as new infrastructure or policy changes, affect other parts of the economy. They include changing transport costs and connectivity.
- Transmission mechanisms (third row). Given any set of changes to the drivers listed in the first row, a set of other effects may occur within the economy due to the resulting increased efficiency, competition and international trade; investment; and innovation.
- Impacts on economic performance (fourth row). The transmission mechanisms may lead to additional development of the economy due to improvements in productivity (of both labour and capital); changes to the structure of the economy; or an increase in labour supply.
- Long-term benefits to the economy (fifth row). Finally, the impact on economic performance can be measured in terms of changes in gross value added (GVA) and/or employment.
How can wider economic impacts be quantified?
Given how influential WEIs are in transport appraisals, it is important to quantify them using a robust methodology. Two main approaches are considered below: ‘bottom-up’ and ‘top-down’.
Bottom-up approach
A bottom-up approach to quantifying WEIs analyses the extent of changes to a number of mechanisms (described below), and thereby the extent of changes due to the existence of market failures. In a hypothetical perfectly competitive market where the level of competition is as high as possible, economic theory indicates that a complete appraisal of user benefits would accurately estimate all economic welfare impacts. However, in practice, most markets are not perfectly competitive, which means that WEIs occur and have an effect on the direct user benefits.2 The bottom-up approach evaluates the economic benefits not captured elsewhere in the appraisal. The Department for Transport’s (DfT) framework, WebTAG, uses such an approach in conducting transport studies, covering agglomeration, labour market impacts, and an increase in output in imperfectly competitive markets.3
Top-down approach
Since the bottom-up mechanisms can be difficult to estimate, and some impacts may not be captured, it may sometimes be preferable to calculate WEIs using a top-down perspective that examines the outcomes, rather than the causes, of WEIs. This approach uses the relationship between macroeconomic effects, GDP, and other macroeconomic variables as a check on the bottom-up approach, to help identify welfare impacts that the bottom-up approach does not capture.
The following are some of the macroeconomic outcomes from a transport scheme that are measured in this approach.
- Productivity: increased efficiency and innovation can occur in the production process, improving the efficiency of firms, and reducing costs to consumers.
- Investment: increased investment by firms improves efficiency and productivity. Labour market improvements, competition, and agglomeration can all lead to increased investment.
- Trade: increases in trade can lead to higher productivity through specialisation. Agglomeration, competition and increased output in imperfectly competitive markets could all increase the level of trade.
A top-down approach evaluates the change in these outcomes, rather than the mechanisms through which the change occurs. For example, a top-down methodology would seek to estimate the change in the level of trade arising from a change in the transport network. In practice, this can be done using the results of academic studies which estimate elasticities with respect to changes in the transport network.4
Comparing the approaches
The relative advantages and disadvantages of each approach can be considered in order to decide which is more suitable for a particular transport project. One of the key advantages of the bottom-up approach is that the estimates for each mechanism can be designed to be additional, so, compared to the top-down approach, there can be less risk of double-counting when adding the estimates. However, the top-down approach can be more straightforward to calculate and has less onerous data requirements. The main advantages and disadvantages of the two approaches are set out in Table 1.
Table 1 Advantages and disadvantages of the two approaches
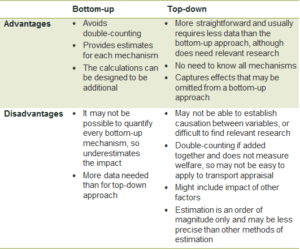
Source: Oxera.
Depending on the particular context of the project, either a bottom-up, a top-down, or a combination of approaches may be most appropriate. For example, in a pre-feasibility study with limited data and/or time, a top-down methodology might be more appropriate to gauge an order of magnitude of the WEI. However, in a more detailed piece of analysis a bottom-up approach might be preferable.
Which approach should be used?
Of the two main approaches, it can be more practical to use a top-down approach to estimate an order of magnitude of a WEI if detailed data about the transport project and surrounding geographical area is not available. If such data is available, however, a bottom-up approach may be more appropriate, and can be sense-checked using a top-down approach.
Given the relative advantages and disadvantages of the two approaches, it may be beneficial to combine them in order to provide a range of estimates for a WEI. While this requires more work, it increases the robustness of the analysis, as the top-down estimate can provide a sense-check on the bottom-up calculations. The two approaches are not mutually exclusive, and can also be combined in a number of ways to provide more robust analysis—although care should be taken to avoid double-counting.
Contact: Andrew Meaney
Download
Related

No water, no growth: tackling inefficient business water demand
Water is not typically thought of as a constraint on economic growth in England. Yet that is precisely what it is becoming. Commercial growth and new developments are being turned away because there is insufficient water to serve them. Some water companies are already exercising their powers to refuse… Read More

The energy trilemma in focus: the price of dependence
Europe’s approach to energy policy has been in transition since the 2022 energy crisis laid bare the continent’s dependence on imported fossil fuels. More recently, the outbreak of war in the Middle East and the subsequent disruption to global oil and gas markets have caused further challenges. This article… Read More