
Anticipating future public policy changes in environmental cost–benefit analysis
In pursuit of net zero targets, public entities worldwide are increasingly employing environmental cost–benefit analysis (CBA). The outcome of such an analysis depends on the public environmental policy standards applicable at that time. But what if these standards change? Ilaria Noviello, Oxera Consultant, and Shaun Tey, Economist at Ofcom, draw on a case study involving the Netherlands Authority for Consumers and Markets (ACM) to explore how policymakers can account for potential changes to public policy when conducting environmental CBA.
This article is based on graduate research by Oxera Consultant Ilaria Noviello together with co-author Shaun Tey. See Noviello, I. and Tey, S. (2021), ‘Green agreement in the electricity market: an ex-post evaluation of the 2013 Dutch coal power plants closure agreement’, Graduate Thesis, Barcelona Graduate School of Economics.
The growing climate emergency is now high on the European political agenda.1 As such, public and private entities are engaging in ambitious environmental initiatives.
Whether they are taxes, large-scale investments in renewables, or private agreements to reduce greenhouse gas (GHG) emissions, such initiatives are typically associated with significant costs—but also benefits that accrue over several years. In addition, policymakers need to assess the impact on carbon budgets of large-scale infrastructure projects that seek to address non-environmental objectives. As a result, public entities around the world are increasingly using cost–benefit analysis (CBA) to assess whether such initiatives would lead to a net benefit in the long term.
However, the standards and methods that governments use to assess the value of environmental initiatives are not static. This can make it challenging to accurately predict the future valuation of an environmental initiative.
This problem of differing ex ante and ex post CBAs is particularly acute with respect to environmental initiatives. This is because the methodologies used by governmental bodies to quantify environmental benefits are subject to change, and the environmental policies of national governments are constantly evolving as they set increasingly ambitious targets to help achieve net zero targets. The combination of changes to the methodologies and increasingly ambitious GHG reduction targets can increase the value that governments place on reducing emissions in later CBAs.
Such factors are important given that national regulatory and planning authorities often use national government methodological guidelines and valuations for their environmental CBAs.
In this article, we explore the relevance of accounting for future changes to public policy by undertaking an ex post CBA of the 2013 analysis by the Netherlands Authority for Consumers and Markets (ACM) of an industry agreement to close five ageing coal power plants for environmental reasons.2
While the annual environmental benefit was determined to be around €30m at the time of the ex ante evaluation in 2013 (and this was deemed insufficient relative to a projected cost of €75m),3 we find that the same evaluation in 2018 (a year after all the coal plants closed) would have produced an annual benefit of roughly €375m due to methodological and policy changes. This example clearly shows that the choice of method can have a significant impact on the outcome.
We also explore the methodological and policy changes that drove this sharp increase in the estimates of the annual benefit, as well as identifying lessons for those working on ex ante evaluations of environmental initiatives and other policy decisions.
The Dutch coal closure agreement
In 2013, the SER ‘Energieakkoord’ (or ‘Energy Accord’) was reached between 47 signatories in the Netherlands (including the Dutch Government).4 One aspect of the Energy Accord was a ‘Green Agreement’ between major energy producers to close down five ageing coal-fired electricity plants five years ahead of the regulated schedule (the Closure Agreement) to facilitate the transition to a sustainable energy supply and reduce GHG emissions.5
Three of the coal plants were to be closed in January 2016 and two in July 2017, even though they were expected to continue to be commercially viable until 2022. The Closure Agreement would therefore result in a reduction in GHG emissions from 2016 to 2021 relative to a scenario where such an agreement did not occur.
The Closure Agreement effectively constituted a horizontal agreement between competing energy producers—which is why the ACM took an interest.
Relying on an external expert analysis,6 the ACM concluded that the total annual cost of the agreement would amount to €75m for Dutch consumers—due to an estimated 10% increase in the wholesale cost of electricity following the reduction in total electricity capacity.7
In terms of benefits, the ACM concluded—based on the same expert analysis—that the agreement would lead to reductions in carbon dioxide (CO2), nitrogen oxides (NOx), sulphur dioxide (SO2) and polluting particles (PM10), as shown in Table 1 below. However, the ACM did not take into account any benefits from the annual reduction in CO2 emissions due to a ‘waterbed effect’ (which will be explained below). Using the then-preferred evaluation method, the remaining benefits were quantified to amount to €29.3m—substantially lower than the estimated costs. As the estimated costs exceeded the benefits, the ACM concluded that the Closure Agreement constituted an anticompetitive agreement within the scope of Article 101(1) TFEU and did not fall within the exception set out in Article 101(3) TFEU.
However, despite the ACM’s conclusion, the Dutch Ministry of Economic Affairs implemented the Closure Agreement, and the five coal plants all closed in 2016 and 2017, as specified in the Closure Agreement.8
Table 1 The ACM’s 2013 evaluation
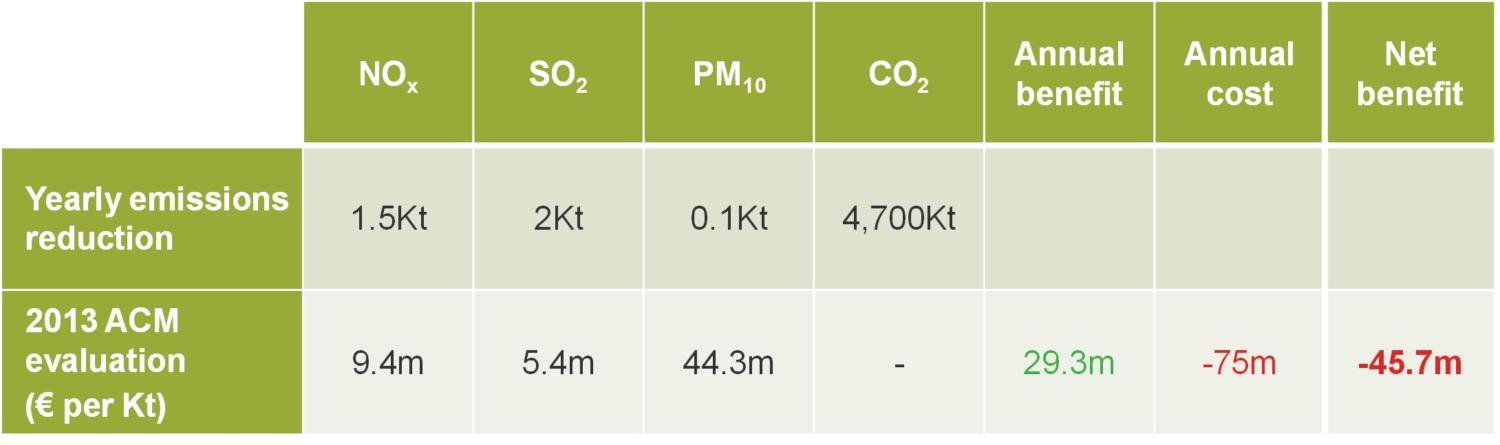
Source: ACM (2013), ‘Analysis by the Netherlands Authority for Consumers and Markets (ACM) of the planned agreement on closing down coal power plants from the 1980s as part of the Social and Economic Council of the Netherlands’ SER Energieakkoord’.
Volatility in the evaluation methods
While the estimated quantity reductions in emissions (in tonnes) remain unchanged over time, the outcome of ex ante calculations of environmental benefits depends substantially on the rules and policies in place when the ex ante analysis is conducted.9
In particular, we find that relatively minor changes to the methodology and policy towards the valuation of environmental benefits would have led to significantly different estimates of the estimated benefits—and indeed to a markedly different conclusion regarding the net benefit of the agreement.
In particular, three developments would have led to a materially different conclusion:
- the valuation method used;
- the shadow price estimates (in this case, the monetary value assigned to reducing emissions);
- the treatment of CO2 emissions.
We discuss each in turn below.
The switch from ‘abatement costs’ to ‘damage costs’ evaluations
The benefits from reducing emissions are commonly estimated using either an ‘abatement costs’ or ‘damage costs’ evaluation (defined in the box below).
What are abatement cost and damage cost valuation methods?
Damage costs are valuations based on the estimated damage occurring as a result of emissions. They are calculated based on people’s willingness to pay to avert damage to the environment.
Abatement costs are valuations based on the costs required to secure binding environmental policy targets. They are calculated as the cost of the most expensive technique required to meet government emission targets. The logic for using the abatement costs method is that when a binding national target exists, the question is whether the environmental intervention that is being evaluated is cost efficient compared to other pollution-reduction methods that are being used.
In 2013, when the Dutch government had set a national reduction target, the preferred valuation method was based on abatement costs.10 The ACM therefore relied on abatement cost valuations for NOx and SO2. However, no abatement cost valuation existed for PM10 emissions (as there was no national reduction target for PM10 at the time). The damage cost valuation for PM10 was therefore used instead.
However, just a few months after the ACM’s analysis in 2013, the Dutch government announced that valuations of emissions should be undertaken using damage costs in all CBAs.11 The only exception would be for evaluations related to climate change (i.e. CO2 and other GHGs), where abatement costs would still be used.
How would this policy change have affected the environmental CBA, assuming that the estimated reductions in emissions and the annual cost remained unchanged?
For its CBA, the ACM relied on the 2010 Shadow Price Handbook by CE Delft, as commissioned by the Dutch government.12 This represented the latest handbook on environmental valuation at the time of the ACM’s valuation in 2013. The policy change would mean the valuations for NOx and SO2 would now be calculated using the damage costs method (as opposed to the abatement costs model). Using the damage cost valuations for NOx and SO2 (as listed in CE Delft 2010 Shadow Price Handbook), Table 2 below shows that the projected reductions in emissions would have still implied a net cost of around €24m, although this is significantly lower compared to the previously expected net cost of roughly €46m.
Table 2 The ACM’s 2013 evaluation, updated based on damage costs valuation as of 2010
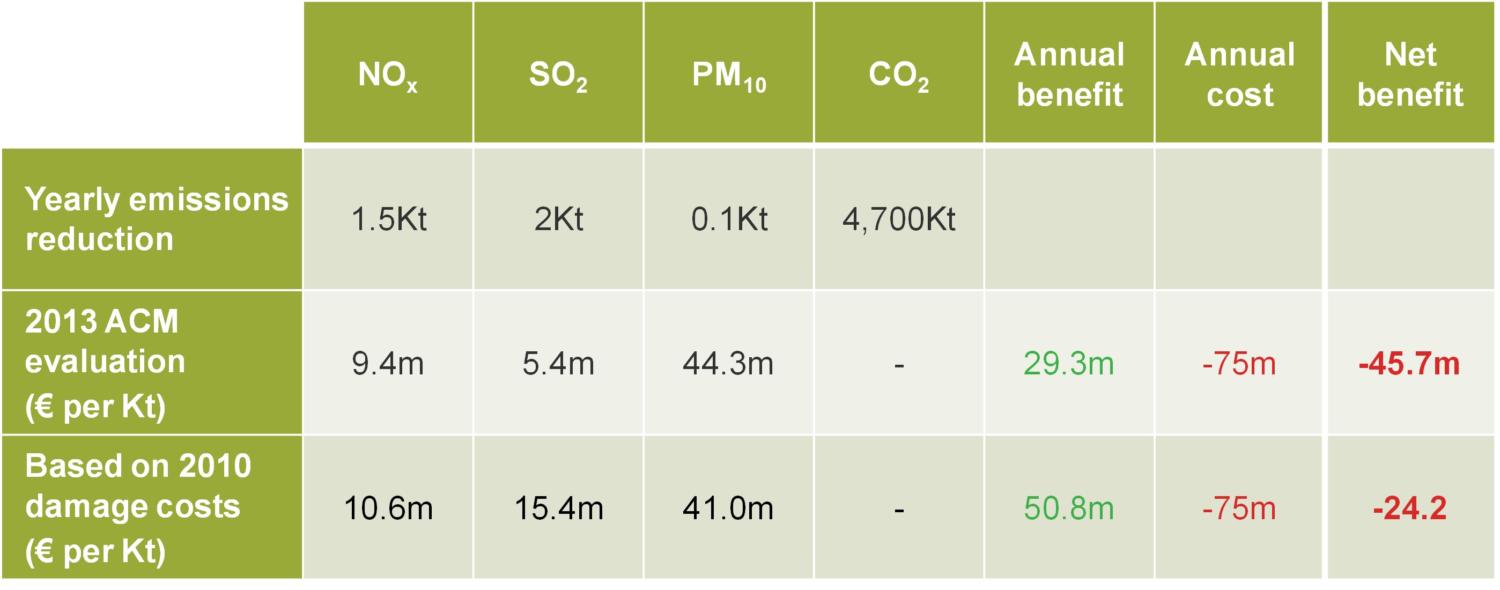
Source: ACM (2013) and CE Delft (2010).
Updated shadow prices
This policy switch from evaluation based on abatement costs to damage costs is not the only change that is relevant for understanding how ex ante and ex post CBAs may differ. Indeed, the damage costs estimates for each kilotonne of emission may change materially as well.
Specifically, the damage costs estimates were updated in CE Delft’s Environmental Prices Handbook 2017 and presented as ranges to reflect varying assumptions.13 Importantly, the newly estimated shadow prices are substantially higher than the 2010 estimates.
These methodological changes led to an increase in the valuation of certain non-CO2 emissions that would have been reduced as a result of the Closure Agreement. As a consequence, if the ACM had assessed the value of the estimated non-CO2 emissions reductions in mid-2018, it would have estimated a net benefit of €31.3m per year (using the mid-point valuations in the CE Delft handbook). Hence it would have obtained a positive estimate of the net benefit, even excluding any reductions from CO2 emissions (see Table 3 below).
Table 3 The ACM’s 2013 evaluation, updated based on damage costs valuation as of 2017
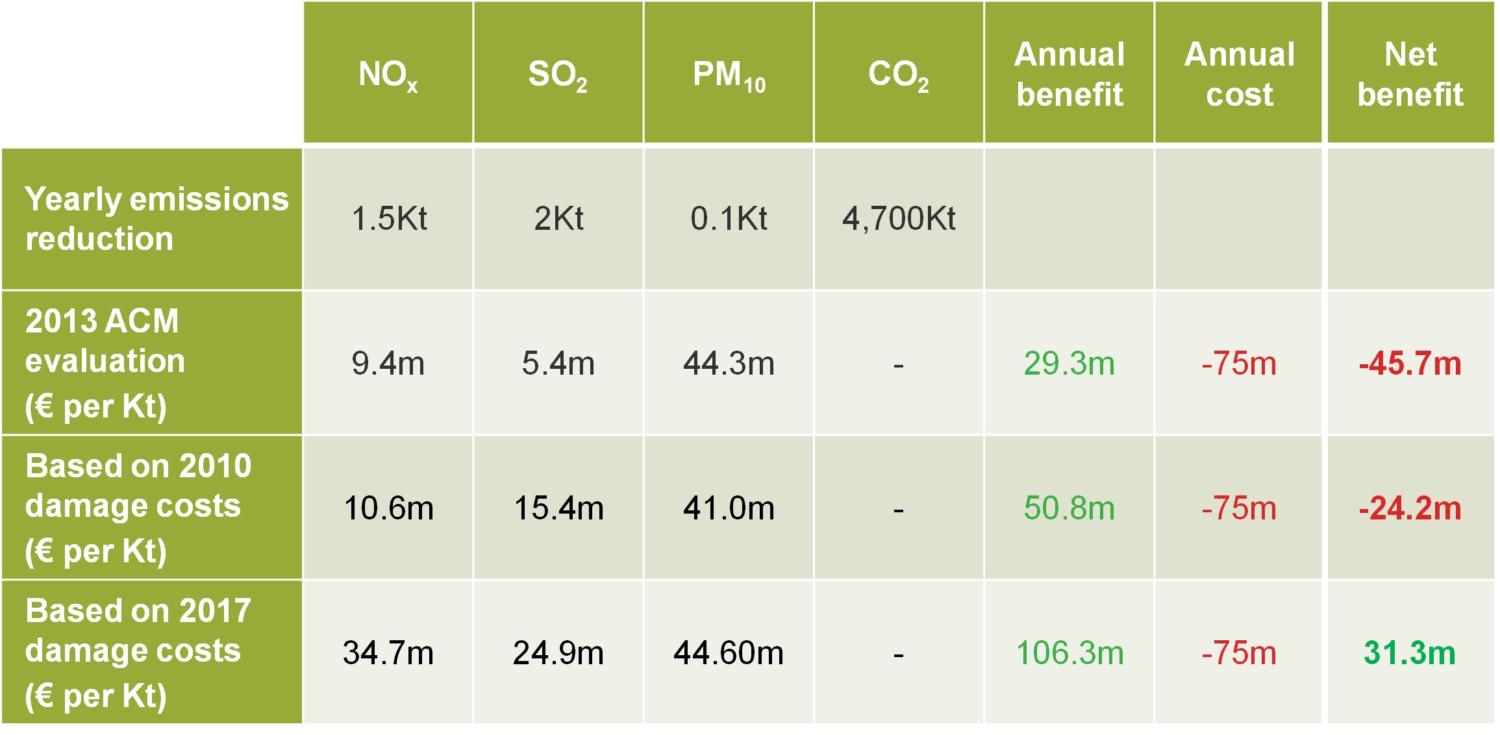
Source: ACM (2013) and CE Delft (2010; and 2017).
CO2 emissions and the waterbed effect
So, what happens if we also account for changing public policy towards CO2 emission reductions?
In its 2013 evaluation, in line with Dutch government policy, the ACM concluded that the annual 4,700kt of CO2 reductions should not be included in the CBA, as the closure agreement would have freed up additional CO2 allowances elsewhere because of the EU’s Emission Trading Scheme (ETS). This is what is meant by the ‘waterbed effect’ (described in the box below).
The EU ETS and the waterbed effect
At the EU level, the EU’s Emission Trading System (EU ETS) has been implemented. It aims to reduce the aggregate GHG emissions in several sectors (including the energy sector) by creating a limited number of tradable allowances—that is, by introducing a cap. Therefore, energy companies will need to use EU allowances (EUAs) to carry out their activities. They can choose to either bank or sell the EUAs that they had previously bought (or were otherwise allocated).
However, the implication of an EU-wide cap is that national measures to reduce emissions from the energy sector may not actually reduce greenhouse gas emissions on a European level. This is because the overall cap for CO2 allowances is set, meaning that reducing emissions from, for example, coal plants in the Netherlands will only lead to freeing up their EUAs, which will then be bought and used by other emitters in Europe. Similar to a waterbed, pressure to reduce the level in one area only leads to increasing the level in another area, but the overall amount in the system remains the same.
However, the Dutch government changed its approach in 2016 as it considered that there was no waterbed effect, and that there was still a benefit in unilaterally reducing national CO2 emissions.14
Furthermore, in 2018 the EU introduced reforms to its ETS, allowing for the removal and cancellation of past excess allowances that had built up in the system over the years. This has meant that unilateral reductions in CO2 emissions no longer free up extra allowances; instead, they have been removed from the market. These reforms have had a retrospective effect (cancelling unused allowances that had accumulated in the market), but also an ongoing effect whereby allowances continue to be removed from the market until a certain threshold is reached.15
These policy changes mean that the waterbed effect would have been mitigated until at least the beginning of 2022,16 which covers the relevant period of the closure agreement.
Considering the shift in Dutch government policy on CO2 reductions and reforms to the ETS by the EU (in addition to the change in how the other emissions were evaluated), the annual benefits from the closure agreement would have been around €375m per year—with an annual net benefit of around €300m (taking the estimated cost as fixed). This is shown in Table 4 below.
Table 4 The ACM’s 2013 evaluation, updated for the damage costs valuation from 2017 and for the new approach to CO2 emissions
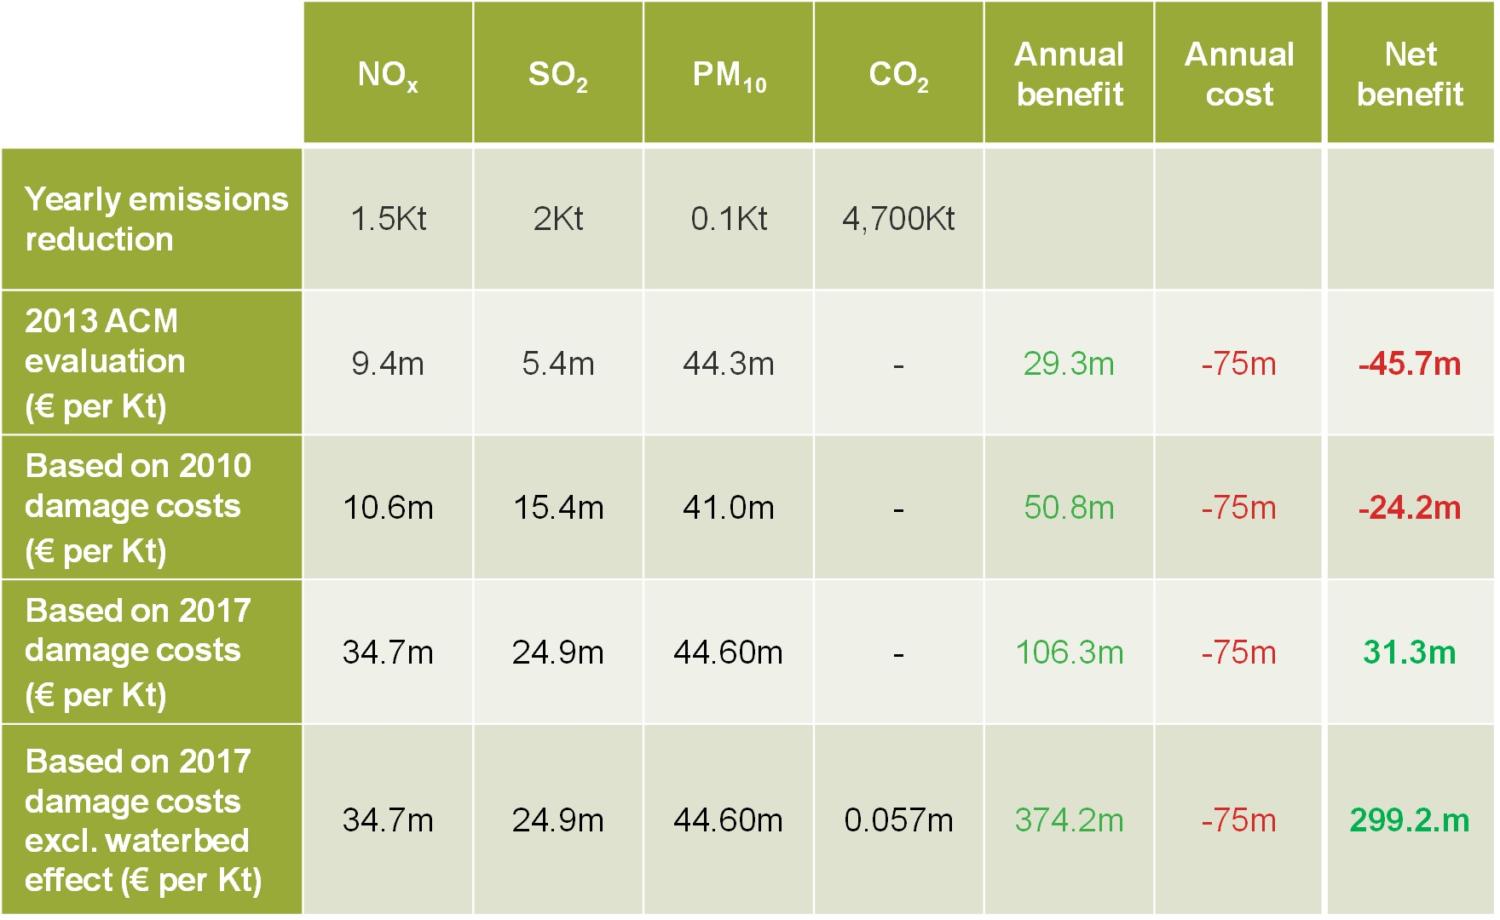
Source: ACM (2013) and CE Delft (2010 and 2017).
Anticipating the future?
The ACM valued the benefit of the agreement at around €30m in 2013. In 2018, a year after all the plants actually closed, the ACM would have instead valued the agreement at around €375m based on the then-applicable evaluation methods. Taking the presumed annual cost of €75m, this illustrates that the difference between ex ante and ex post environmental CBA is potentially material.
To be clear, we do not know whether the ACM was aware of the upcoming changes. Our aim is to set out the impact of the changes, as well as drawing lessons for national competition authorities on how their decisions could interact with future changes in policies made by their governments.
In principle, it would be inconsistent for a competition authority to conduct a counterfactual analysis in one respect (‘How would emissions and energy prices change with and without the agreement in the following years?’), but not in another respect (‘How would public policy change—and hence environmental benefits change—in the following years?’).
Applied to the case study discussed here, to resolve this inconsistency, the ACM would have had to consider the evaluation methodology that was projected to apply in 2022 during its ex ante evaluation back in 2013. Such considerations could then have been reflected in its assessment to ensure that all relevant factors were considered.
Of course, no one has a crystal ball. However, environmental CBAs are inherently forward-looking. Those who prepare or scrutinise ex ante evaluations of environmental initiatives and other decisions with environmental impacts might usefully reflect not just on what types of benefits or costs are likely to occur, but also on the different ways in which they could be valued once the impacts of these initiatives arise. The case study discussed here illustrates that it cannot be assumed that contemporary methodologies will be maintained. Instead, it may be prudent for policymakers and authorities to be explicit about where existing methodological stances may be susceptible to alteration in the future.
Anticipating future public policy changes is challenging, but having an awareness of what existing policies are currently under review, or where the politics is heading, can help us to make more informed decisions.
1 European Commission (2019), ‘Communication from the Commission to the European Parliament, the European Council, the Council, the European Economic and Social Committee and the Committee of the Regions: the European Green Deal’, technical report.
2 ACM (2013), ‘Analysis by the Netherlands Authority for Consumers and Markets (ACM) of the planned agreement on closing down coal power plants from the 1980s as part of the Social and Economic Council of the Netherlands’ SER Energieakkoord’.
3 Ibid.
4 SER (2013), ‘The Agreement on Energy for Sustainable Growth: A policy in practice (English Version)’.
5 The five coal-fired power plants are: Gelderland, held by GdF; Borssele, owned by Delta; Amer-8, owned by RWE; and Maasvlakte 1 and 2, owned by E.ON. See ACM (2013), ‘Analysis by the Netherlands Authority for Consumers and Markets (ACM) of the planned agreement on closing down coal power plants from the 1980s as part of the Social and Economic Council of the Netherlands’ SER Energieakkoord’, p. 2.
6 ECN (2013), ‘Effecten van versneld sluiten van de vijf oudste kolencentrales’.
7 Throughout this article, we assume that the €75m estimated costs are given. This estimated cost underpinning the environmental CBA is also analysed from an ex post perspective in our thesis—see Noviello, I. and Tey, S. (2021), ‘Green agreement in the electricity market: an ex-post evaluation of the 2013 Dutch coal power plants closure agreement’, Graduate Thesis, Barcelona Graduate School of Economics.
8 Dutch Coal Covenant (2019), ‘Final Report 14/19’, p. 10.
9 For the purposes of this ex post evaluation, we have retained the ACM’s assumptions about how many kilotonnes of emissions would be cut each year due to the agreement. However, we have updated how the benefit of each kilotonne reduced is valued.
10 CE Delft (2018), ‘Environmental Prices Handbook 2017: Methods and numbers for valuation of environmental impacts’.
11 CPB and PBL (2013), ‘General Guidance for Cost-Benefit Analysis (English version)’.
12 CE Delft (2010), ‘Shadow Prices Handbook: Valuation and weighting of emissions and environmental impacts’.
13 CE Delft (2018), ‘Environmental Prices Handbook 2017: Methods and numbers for valuation of environmental impacts’, Report, May.
14 CPB and PBL (2016), ‘WLO-klimaatscenario’s en de waardering van CO2-uitstoot in MKBA’s’.
15 Perino, G. (2018), ‘New EU ETS phase 4 rules temporarily puncture waterbed’, Nature Climate Change, 8:4, pp. 262–4.
16 CE Delft (2019), ‘Effecten van sluiting drie extra kolencentrales’.
Contact

Ilaria Noviello
ConsultantGuest author
Shaun Tey
Economist at Ofcom
Related
Related

Modernising EU competition policy: from guidelines to outcomes
This special edition of Top of the Agenda was recorded at our 2026 Brussels conference, which hosted senior figures from the European Commission, national competition authorities, academics and the legal community to discuss one of the most significant developments in EU competition policy in two decades: the revision of… Read More

When does a discount become deceptive? An economic framework for the regulation of reference pricing
The use of ‘reference’ pricing—where a previous (or future) ‘was’ price is displayed alongside the current ‘now’ price to indicate a discount for customers—is a common feature across digital and physical markets. In supermarkets, retailers commonly advertise a headline Recommended Retail Price (RRP), or ‘was’ price, alongside the current… Read More