
Goodbye tension, hello pension! Metrics to help consumers choose the best deals
In July 2017, Oxera and CESS published the results of an experiment to identify the effectiveness of different summary cost metrics (information about total costs) in aiding consumer selection of income drawdown pension products. The study, commissioned by the UK Financial Conduct Authority (FCA), shines some light on how consumers respond to cost metrics and how, in this case, simplicity is not necessarily the most effective approach.
In April 2015, those saving for retirement in the UK gained a degree of flexibility over how they used their savings. These ‘pensions freedoms’ provided new opportunities, including greater access to income drawdown products. An income drawdown product is where the consumer leaves their pension pot invested and takes an income directly from it, instead of converting the pot into a guaranteed income for the rest of their life.
Sales of income drawdown products subsequently grew sharply, from 9,500 to 18,800 per quarter (Q2 2014 to Q2 2015), eventually overtaking sales of pension annuities.1 Many of those who choose income drawdown products rely on financial advice, although a substantial minority (35% in Q3 2016) purchase drawdown without advice.2
There are different ways of presenting the cost of an income drawdown pension product. In this context, the FCA wished to understand which way of summarising the cost best enabled consumers to identify which of a range of product options was the most cost-effective for them. Effective competition in pensions relies on consumers being able to correctly assess the costs of income drawdown products and compare these across providers.
Choice of income drawdown product
Income drawdown products can be relatively complex products with multiple features and often with an array of fees. Charges and fees vary with pot size and how the product is used, so the same drawdown product could be relatively cheap for one consumer, but relatively expensive for another.
In order to get the best deal, consumers need to compare products across multiple dimensions, usually with no single price or fee to focus on. For example, some income drawdown products have a range of administration fees, including initial set-up fees, transfer fees, annual administration charges, and product fees, whereas others may have only an annual administration charge.
Comparing the costs of income drawdown products typically involves calculating:
- percentage fees—people often do not interpret percentage fees correctly;3
- the addition of percentage and flat fees—this can be a challenging calculation;
- fees that vary by tier—this can also be a non-trivial calculation.
Choosing a pension product is an infrequent event for most people—so there is limited opportunity to learn from past experience. There is also limited opportunity to learn from other people’s experiences, as the market is relatively new and the consequences of the choice of an expensive pension product play out over many years.
In theory, a single summary cost metric could accomplish three goals, and enable better decision-making, by:
- bringing to light any ‘hidden charges’ or charges in the small print;
- reducing information overload and making it easier for consumers to compare a large number of underlying charges. Instead of computing the cumulative impact of numerous fees that vary by magnitude, form (percentage or fixed) and timing (one-off, annual or incurred following consumer actions), consumers would have to compare only a single figure;
- making it easier for consumers to compare charges based on likely product usage.
In reality, as shown in the box, consumers may be subject to a range of biases when choosing complex products.
What consumer biases are involved in the choice of income drawdown product?
The decision about which income drawdown product to select is complex, and the rational, rules-based side of the brain—or ‘System 2’—may find it difficult to arrive at the right answer.1 The consumer may then rely on what their instinct tells them, or rules of thumb (‘heuristics’). This is the more emotive, and essentially behavioural, System 1. While System 1 can offer useful shortcuts, it can make consumers more susceptible to making poor decisions when faced with complexity—in this case, selecting a more expensive provider.
There are various reasons why a consumer may select a more expensive provider (all of which stem from suppression of System 2 reasoning, and biasing of System 1), including:
- information and choice overload—this can lead to ‘status quo bias’, where, even when offered alternative deals, consumers select their existing ‘trusted’ pension provider for income drawdown (for example, due to loss aversion and regret avoidance);
- narrow framing and salience of particular charges—this will lead customers to focus on some fees (e.g. set-up fees) more than others; consumers may then compare only two or three providers and select the best of these, rather than searching the whole market for the best deal overall;
- multiple attributes generating faulty heuristics—consumers who do shop around may choose the wrong product and/or provider as they use over-simplistic rules of thumb;
- optimism bias in terms of forecasting future use—for example, consumers may underestimate the number of ad hoc withdrawals they will make. The uncertainty around a consumer’s future consumption requirements means that they are likely to find forecasting drawdown usage difficult, even if they are not over-optimistic;
- mistakes—consumers may simply lack the ability to compare the offerings effectively, and choose a poorer deal (for example, by focusing on salient set-up charges only, or underestimating usage and ad hoc charges).
Note: 1 The psychologist, Daniel Kahneman, set out the concepts of two modes of thought, referred to as ‘System 1’ (fast, instinctive and emotional) and ‘System 2’ (slower, more deliberative and more logical), in Kahneman, D. (2011), Thinking, Fast and Slow, Macmillan.
The Oxera/CESS study
The experiment tested the effectiveness of five summary cost metrics in a price-comparison website setting, where participants were incentivised to choose the cheapest income drawdown product. Our sample comprised 2,020 participants from the UK population nearing retirement age (aged over 40, with a mean and median age of 58). The experiment sought to encourage participants to act as they would in real life:
- they were asked to choose the cheapest product from a table—as on a real-world price-comparison website;
- product charges and features were similar to those of income drawdown products in the real world;
- the language used in the experiment was based on the language mandated or recommended by the FCA;
- participants were presented with vignettes describing how hypothetical individuals planned to use their income drawdown product, and were asked to identify with one. This put them in the ‘mindset’ of someone choosing an income drawdown product.
So which summary cost metrics were presented to help consumers? In the experiment, participants were faced with one of the following.
- Control treatment—no summary cost metric, and five core charges: initial set-up fee, transfer-in payment, annual administration charge, product fee, and unscheduled withdrawal fee.
- Reduction in yield—as with the control treatment, but with reduction in yield (%) calculated over a 20-year time period shown as a summary cost metric. Reduction in yield was described as ‘The reduction in the annual returns of your pension, as a result of the charges that you will be paying’.
- Pension savings available after costs—as with the control treatment, but with the present £ value of the pension pot less the present value of costs for a product over a 20-year period (discounting based on assumed investment return) shown as the summary cost metric. Pension savings available after costs were described as ‘The estimated value of your pension pot, at this time, after taking account of the impact of all charges over the next 20 years on the income drawdown product you choose’.
- Average cost (per year)—as with the control treatment, but with the average £ cost of a product over a 20-year period shown as the summary cost metric. Average cost was described as ‘The estimated average £ amount per year of charges that you are likely to pay on your income drawdown product’.
- Total cost (20 years)—as with the control treatment, but with the total £ cost of a product over a 20-year period shown as the summary cost metric. Total cost (20 years) was described as ‘The total charges over 20 years that you are likely to pay on your income drawdown product’.
- Cost rating—as with the control treatment, but with a rating summarising all charges from a product on a scale from £ (cheapest) to £££££ (most expensive)4 shown as the summary cost metric. The cost rating was described as follows: ‘The charges rating summarises all charges for the income drawdown product on a scale from £ (cheapest) to £££££ (most expensive). The scale provides a simple comparison of charges across different products on offer’.
To reflect the complexity of real-world choice in this market, the summary cost metric was placed alongside a number of other (financial and non-financial) product characteristics. The table of products was also designed to be sufficiently complex such that the treatment summary cost metric was not overly prominent and therefore salient in the decision-making process. The table of products listed 18 products5 according to four ‘quality’ measures and five fees (seven fees in the complex control), plus the treatment metric. Participants were able to see definitions by hovering their mouse over question-mark symbols next to the column headings, and could click on ‘Explore charges’, which listed the charges information as shown in the table of products.
The best product in each table was set to be dominant across price and quality features—if participants valued quality highly and made a trade-off between quality and price, they should therefore still choose the cheapest product.
Participants were paid £4 for taking part in the experiment, and could earn up to another £3 if they selected the cheapest product, with the payout decreasing in 25p increments according to the ranking of the product. Choosing one of the most expensive six products received zero additional payout. An example of a screen that participants were presented with in the experiment is shown in Figure 1.
Figure 1 Table of products with cost rating treatment shown
Which cost metric was most effective?
Two of the summary cost metrics, pension savings available after costs and average cost per year, had a statistically significant positive impact on the product choices of participants, which resulted in them selecting lower-cost products on average, and being better able to select the cheapest product. This is shown in Figure 2.
Figure 2 Proportion of participants who chose the cheapest product
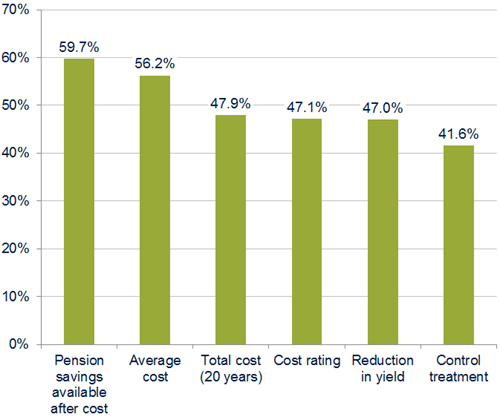
When considering the product selection over all the products (rather than just whether participants chose the cheapest product), pension savings available after costs had a greater positive impact than the average cost per year, although the difference was relatively small. This econometric analysis suggests that these two metrics provide the most robust basis on which to form policy (after taking account of all other factors, such as age, education, and financial literacy).
The robustness of the results was tested through a wide range of econometric analyses, including different model specifications for the ordinary least squares (OLS) regressions on reward and the Logit regressions for the likelihood of picking the cheapest product or avoiding the more expensive products.6
The ordering of the treatments was robust to these different model specifications. Pension savings available after costs was the most successful treatment in all cases, followed by average cost. The other treatments were less successful in all cases.
Why are some summary cost metrics more effective than others?
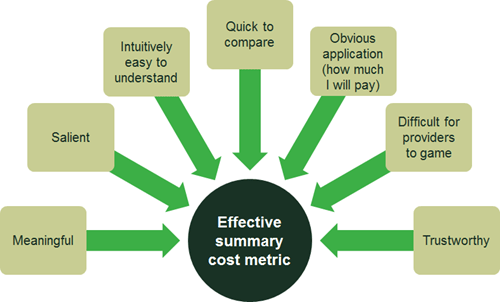
Why might the pension savings available after costs and average cost metrics be more effective cost metrics than reduction in yield?
They are presented as a £ rather than a % figure. Many people find it hard to understand percentages. A cost metric that uses % figures will increase the chances of the consumer making a mistake or being discouraged from engaging with the metric.7 In addition, the levels of % figures are often lower and therefore less salient than £ figures (for example, reduction in yield is less likely to be as salient with figures that vary from 1.37% to 2.01% than the equivalent figures in £).
Why might these metrics be more effective than cost rating?
They are trustworthy. People may not trust cost rating to truly reflect and incorporate all the fees relating to a product, but the other treatments, including pension savings available after cost, do not face this problem. The simplicity of cost rating may reduce trust in its comprehensiveness or accuracy.
They are specific. Although the usage of the product is approximated (for example, there is a certain number of ad hoc withdrawals in each profile), the metric is otherwise directly relevant and specific to the consumer viewing it.
Pensions savings available after costs may be an especially effective summary cost metric because it avoids doubt over the relevance of costs and saves a cognitive step. The first cognitive step for someone reading a total cost or average cost is likely to be to calculate how it would affect their pension—for example, by asking ‘is a total cost of £20,000 high?’ or ‘what does that mean for my savings?’. The pension savings available after costs metric does not require the consumer to calculate the impact of the cost on their savings. This makes it easier to understand, and has an obvious application.
These conclusions are summarised in Figure 3.
Figure 3 Effective summary cost metric
Wider implications
A number of lessons can be drawn from the Oxera/CESS experiment.
Consumers are not always willing or able to process complex pricing structures to calculate which product is cheapest for them. The introduction of a summary cost metric can therefore improve their ability to assess products and make an informed decision. The best summary cost metrics are those that require the least cognitive effort to understand while remaining trustworthy. This does not mean that the metrics are necessarily simple in construction—the two most effective metrics in this experiment are clearly more complex than the cost rating, which did not perform as well.
The findings of this experiment are important beyond the pensions and financial services sector, as concerns about the ability (or inability) of consumers to pick the cheapest product are shared by regulators and competition authorities across various markets around the world.
This article is based on Oxera and the Nuffield Centre for Experimental Social Sciences (CESS) (2017), ‘Annex 5: Identifying metrics to aid consumer choice in the income drawdown market’, prepared for the Financial Conduct Authority, March.
1 Association of British Insurers (2015), ‘UK Insurance & Long Term Savings: Key Facts 2015’, September, accessed 3 February 2017. Income drawdown sales have since levelled off at around 26,000 per quarter—see Association of British Insurers (2017), ‘The new retirement market: the evolution continues’, 11 April.
2 Financial Conduct Authority (2016), ‘Data Bulletin’, Issue 8, February.
3 Banks, J. and Oldfield, Z. (2006), ‘Understanding pensions: cognitive function, numerical ability and retirement saving’, Institute for Fiscal Studies Working Paper WP06/05, final version, February, accessed 3 January 2017.
4 Just one product was marked as being in the cheapest cost category (£).
5 The products were not presented according to any kind of ranking (and no indication was given to participants of any kind of ranking), and the table of products did not have any kind of ‘sort by’ function. In the experiment the cheapest product was listed third in all the treatments. Therefore, if any participants reduced their decision to just the products at the top of the table, they could still choose the cheapest product.
6 Linear regressions, such as OLS, measure the impact of explanatory variables on a dependent variable that can take any value. Logit regressions, however, measure the impact of explanatory variables on a binary dependent variable (one that can be only 0 or 1). The estimated coefficients from Logit regressions represent the probability that the dependent variable is 0 or 1.
7 Banks, J. and Oldfield, Z. (2006), ‘Understanding pensions: cognitive function, numerical ability and retirement saving’, Institute for Fiscal Studies Working Paper WP06/05, final version, February, accessed 3 January 2017.
Download

Related

Time to get real about hydrogen (and the regulatory tools to do so)
It’s ‘time for a reality check’ on the realistic prospects of progress towards the EU’s ambitious hydrogen goals, according to the European Court of Auditors’ (ECA) evaluation of the EU’s renewable hydrogen strategy.1 The same message is echoed in some recent assessments within member states, for example by… Read More

Financing the green transition: can private capital bridge the gap?
The green transition isn’t just about switching from fossil fuels to renewable or zero-carbon sources—it also requires smarter, more efficient use of energy. By harnessing technology, improving energy efficiency, and generating power closer to where it’s consumed, we can cut both costs and carbon emissions. In this episode of Top… Read More