
Making a difference: supporting investment in low-carbon electricity generation
The Contracts for Difference (CfD) scheme is one of the UK government’s main mechanisms for supporting investment in low-carbon electricity generation. In the last two CfD allocation rounds, offshore wind generators secured 95% of the available support at much lower prices than previously achieved. What does this mean for the design of the scheme in the future? Is there any merit in guaranteeing some support for less developed (and more costly) technologies, and what other objectives are policymakers considering when choosing technologies to compete with each other for CfDs?
The UK has ambitious decarbonisation targets that include the legally binding aim of reducing greenhouse gas emissions to net zero by 2050.1 Reaching these targets will require significant new investment in low-carbon electricity generation. The objective of the UK government’s CfD scheme is to provide investment certainty by giving projects long-term revenue certainty, typically for the first 15 years of their operation.
How the scheme works
The scheme is funded by a levy paid by licensed electricity retailers. The CfD itself is a contract between a low-carbon generator and the government-owned Low Carbon Contracts Company (LCCC), with an agreed ‘strike price’ (a price in £/MWh determined by a competitive auction).2 CfD recipients are expected to sell their electricity into the wholesale energy market. In addition, if the ‘reference price’ (a specified measure of the ‘average’ wholesale electricity market price in Great Britain) is lower than the strike price, the LCCC will pay the difference to the generator as a top-up payment. If the reference price is above the strike price, the generator is required to pay back the difference to the LCCC. Low-carbon generators with a CfD are therefore expected to earn close to the strike price for the duration of the contract.
CfDs are awarded in competitive auctions in which the developers submit bids for the strike price per unit of renewable electricity produced (measured in MWhs) that they would require to complete the investment in a specified delivery year. In general, the projects that submit the lowest strike prices receive CfDs, subject to the government’s overall budget constraint (the Control for Low Carbon Levies) and other detailed rules.3 All winning projects receive the ‘clearing’ strike price, which is the highest successful strike price bid.
There have been three CfD allocation rounds (ARs) so far—in 2015 (AR1), 2017 (AR2), and 2019 (AR3).4 AR4 is planned for 2021.
‘Pots’ for different technologies
The scheme is open to all eligible technologies, which are currently grouped into two different technology ‘pots’. The two pots do not directly compete with one another within the auction, and a separate strike price is established for each.
The structure of the pots has developed as follows.5
- Pot 1 contains ‘established’ technologies including onshore wind and solar, as well as energy from waste with combined heat and power (CHP), hydro, coal-to-biomass conversions,6 landfill gas and sewage gas. There was a budget for Pot 1 in AR1 but not in the subsequent two auctions. For the upcoming AR4, Pot 1 technologies are expected to be eligible again.
- Pot 2 contains ‘less established’ technologies including offshore wind, as well as remote island wind, wave, tidal stream, advanced conversion technologies, anaerobic digestion, dedicated biomass with CHP and geothermal.
The clearing strike prices from the first three ARs are shown in Figure 1. Prices for Pot 2 have fallen significantly over time as offshore wind farms have won the vast majority (around 95%) of CfDs in AR2 and AR3.
In light of this, the Department for Business, Energy & Industrial Strategy (BEIS) is consulting on whether the current pot structure is still adequate and, in particular, on whether offshore wind should be moved to a separate pot.7
Figure 1 Clearing strike prices in the CfD allocation rounds (2018 £/MWh)
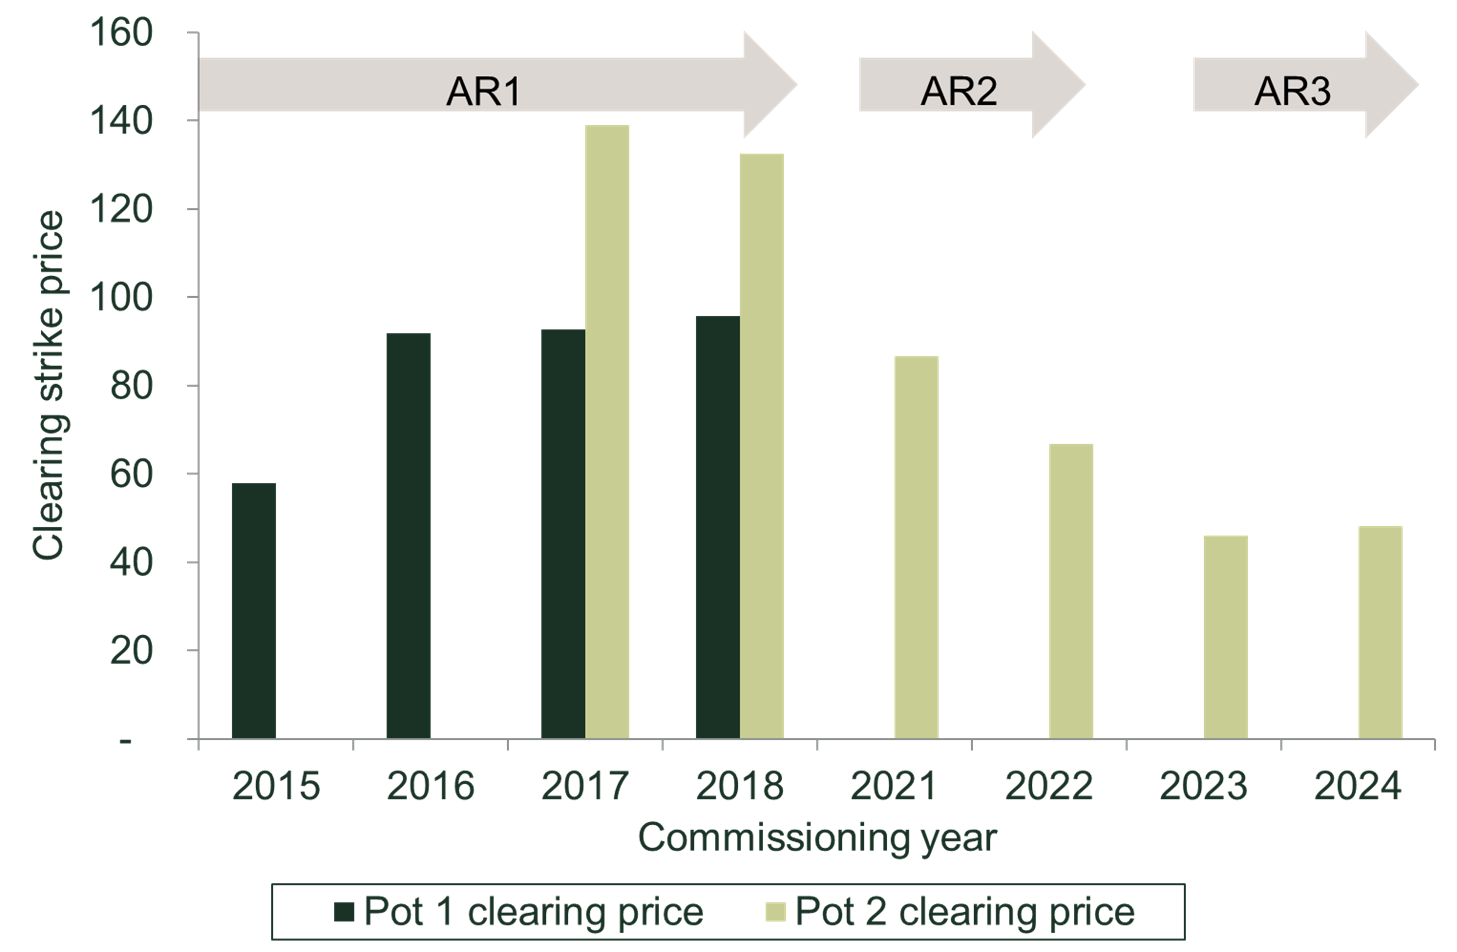
Source: Department of Energy & Climate Change (2015), ‘Contracts for Difference (CFD) Allocation Round One Outcome’, 26 February; Department for Business, Energy & Industrial Strategy (2017), ‘Contracts for Difference Second Allocation Round Results’, 11 September; Department for Business, Energy & Industrial Strategy (2019), ‘Contracts for Difference Allocation Round 3 Results’, September.
When should technologies compete within the same pot?
Short-term consequences
We first consider the direct consequences of different pot structures on the auction outcome. An illustrative example of the auction selection process is provided in Figure 2. In the left chart, there is a single pot for both the grey and the green technology. The bars represent bidding prices. These are ordered from lowest to highest, and the projects with the lowest bids are accepted until the budget is exhausted (corresponding to quantity Q). The clearing strike price is set by the last accepted bid (P).8 The chart on the right shows the auction with two different pots. Again, bids are ordered and then accepted in increasing order, but in this case there are effectively two auctions resulting in two separate clearing prices (P1 and P2).
Figure 2 Illustrative example of auction outcome under one or two pots
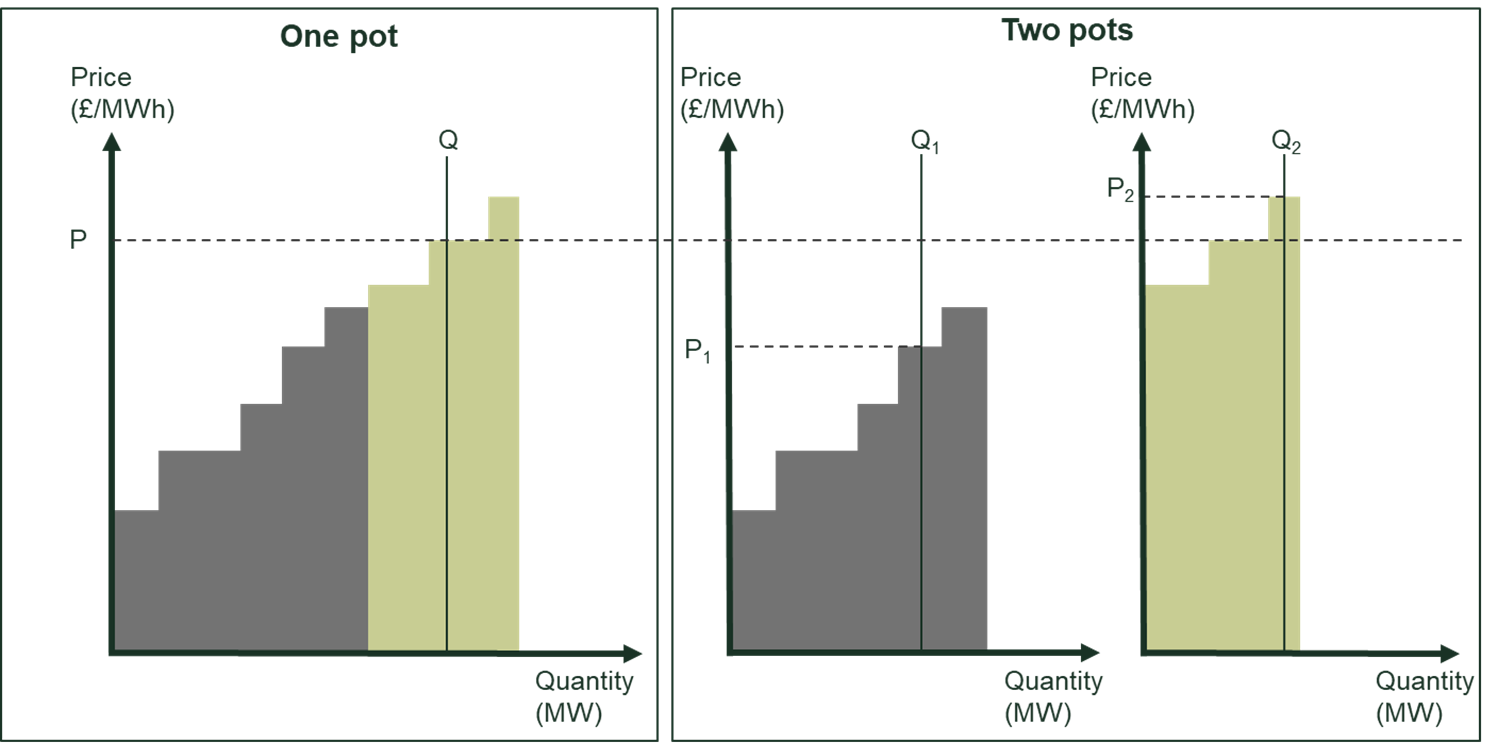
Source: Oxera.
When considering the grouping of technologies into different pots a number of effects on the auction outcome need to be assessed.
- Efficiency of the auction outcome. Do the ‘right’ generators win CfDs? Having a single pot is likely to be most efficient in the sense that it guarantees that the least expensive projects win out; but there could also be other benefits of maintaining separate pots (discussed in the next section).9
- Prices and cost implications. Does the mechanism lead to the lowest costs for the government? Whether the average clearing strike price is lower under one or several pots depends on the cost differences between technologies and the extent to which capacity constraints exist for the cheaper technology. If there are very large cost differences between technologies and the cheaper technology is capacity-constrained, then separating them out into different pots is likely to lead to a lower average clearing strike price. This is because in a combined auction the price paid to all bidders would be set by the much more expensive generator. The example in Figure 3 shows a much cheaper technology (grey, for which only limited capacity exists) receiving a strike price set by the expensive technology (green) under a single pot. If the technologies are grouped into separate pots, the cost to government falls significantly.
Figure 3 Illustrative example of large price difference as a result of splitting into two pots
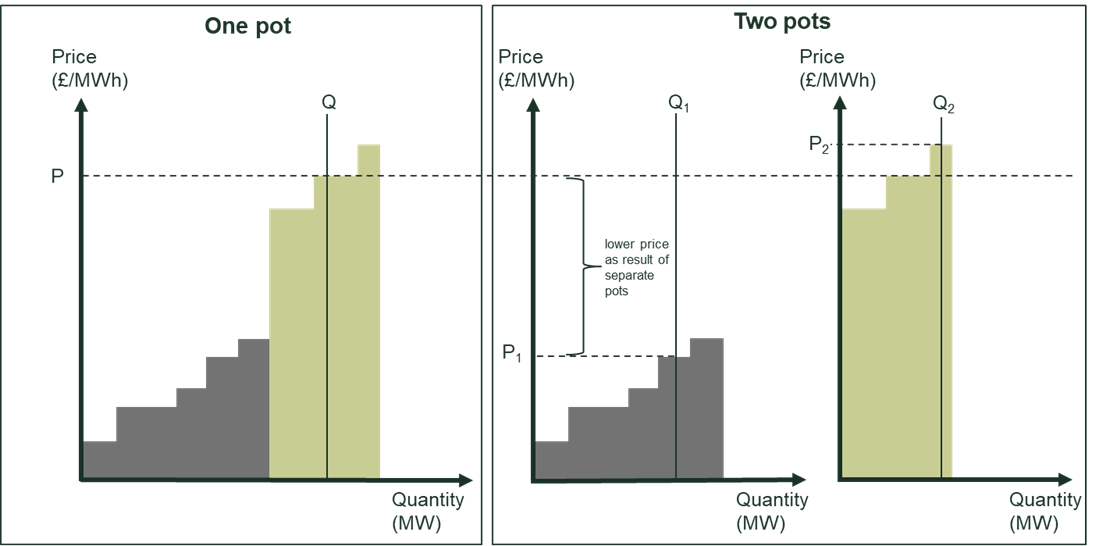
Source: Oxera.
- Competition in the auction. Is there still sufficient competition within each pot? As set out above, separate technology pots can lead to lower auction prices. However, there still needs to be sufficient competition within each pot to avoid strategic bidding behaviour or collusion.10 The budget allocated to each pot is also relevant in order to ensure effective competition. For instance, if the budget for a pot is so large that all generators are likely to be successful, then this could lead to excessively high bids as there are no competitive constraints.
If lower-cost technologies are capacity-constrained, then other ways of grouping technologies can lead to more effective competition and drive down prices within the CfD auction. This benefit of splitting into pots is greater the larger the differences are in costs between technologies. However, if costs are not known to the auctioneer or if there is significant overlap between costs of different technologies then the case for separate pots is less clear.
Figure 4 LCOE estimates for projects being commissioned in 2025 (2018 £/MWh)
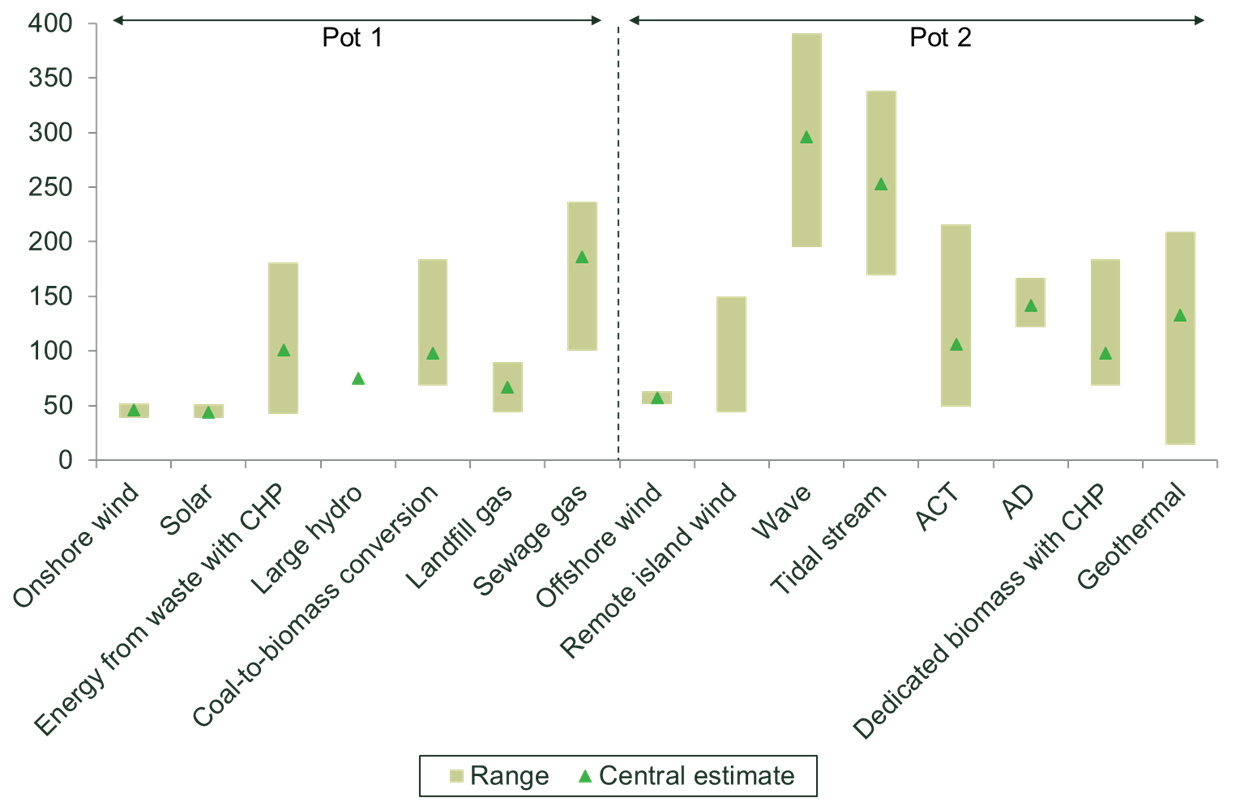
Source: Department for Business, Energy & Industrial Strategy (2020), ‘Electricity generation costs 2020’, August, Table 9; Bloomberg, ‘LCOEs’; Baringa/TNEI (2013), ‘Scottish Islands Renewable Project: Final Report’, 14 May.
Figure 4 shows cost estimates for all technologies in the current Pots 1 and 2 as calculated by BEIS.11 These are shown as levelised costs of electricity (LCOEs),12 which allows for a like-for-like comparison of costs for different types of generation. The chart shows that cost estimates for different technologies vary widely. Onshore wind and solar are shown to have the lowest cost, ranging from £39/MWh to £51/MWh (solar) and £52/MWh (onshore) in 2018 prices. For offshore wind, BEIS calculated a range of £51/MWh to £63/MWh, although the lower end of the range is still above the clearing price achieved in AR3 of around £48/MWh.13 For most other technologies, there is a significant amount of uncertainty and/or variation around costs. The central estimates for most technologies are also significantly higher than for wind and solar. Figure 4 suggests that there are significant cost differences between some more and less mature technologies but not between offshore wind, onshore wind and solar. This leaves the question, are the cheaper technologies capacity-constrained? Estimates of resource potential suggest that significantly more capacity could be deployed than at present.14 For onshore wind, offshore wind and solar, estimates show that for each technology individually there is more resource potential than the approximate 12GW15 figure reported to receive CfDs in the upcoming auction.16 This suggests that if offshore wind were to stay in Pot 2, then—like for AR3—the less mature technologies would be unlikely to be particularly successful in the upcoming auction, although clearing strike prices may well be lower than they would be with separate pots.
Long-term consequences
There are also longer-term implications of the CfD auction results, as they influence the extent to which different technologies will be deployed in the future. The auction design should therefore take into account how the different technologies align with the UK’s decarbonisation and industrial strategies. The UK has ambitious targets for the roll-out of renewables. For instance, as part of its offshore wind industrial strategy, the government has recently agreed to a sector deal,17 including commitments from both government and industry. The sector deal includes forward visibility of future CfD rounds. This is linked to a fivefold increase in exports, and the sector has committed to investing up to £250m in building a stronger UK supply chain. As a result of these long-term strategies, there is a whole range of objectives from the government influencing the design of CfD auctions.
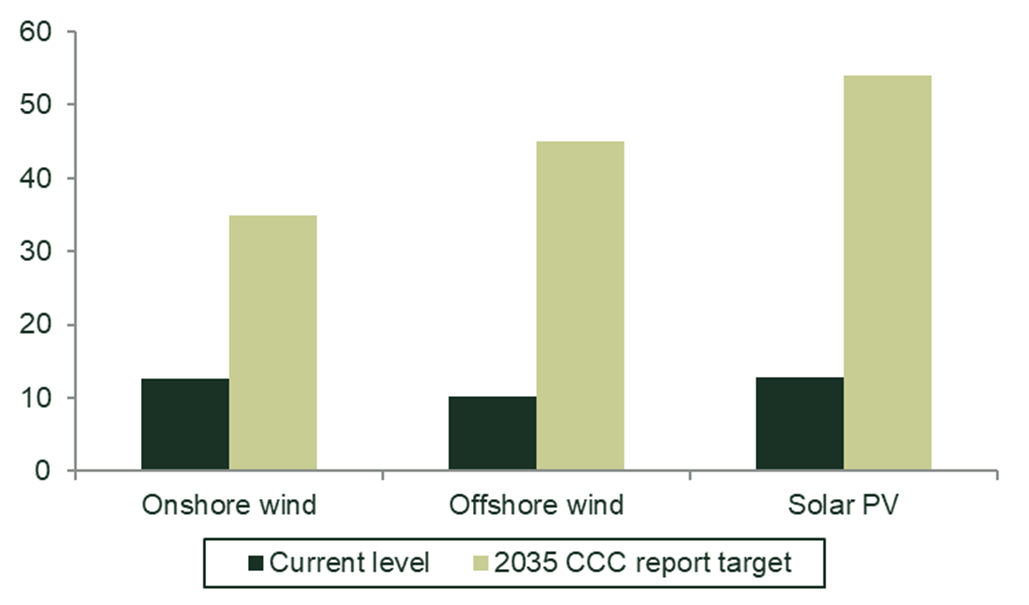
First, the government needs to ensure that the necessary capacity is built in order to reach net zero. According to the Committee on Climate Change’s net zero report, the UK would need up to 35GW of onshore wind, 45GW of offshore wind and 54GW of solar PV by 2035.18 This would require significant investment compared to current capacity levels of around 10−12GW for each technology, as shown in Figure 5.
Figure 5 Current levels and targets for wind and solar capacity (GW)
In the last CfD auction, around 5.7GW of capacity secured a CfD (with 95% of this going to offshore wind). This would still leave significant capacity investments to be funded through other means. The most common alternative funding models are corporate power purchasing agreements (CPPAs), which are long-term bilateral contracts between large buyers and generators to remove financial uncertainty for both sides. Alternatively, ‘merchant plants’ are generators that simply sell into the electricity wholesale market, thereby being exposed to significant price fluctuations. Given the historical capacities of CPPAs in the UK of less than 0.2GW per year,19 and the reluctance to finance merchant wind farms,20 CfDs remain a key source of funding to incentivise investment in renewables.21
Second, the cost implications for the energy system do not only depend on clearing strike prices. The UK needs its generation to be sufficiently diverse so that the system can better cope with the expansion of intermittent generation. In particular, if different generators are highly positively correlated (e.g. because wind speeds within a country are highly correlated), then there is likely to be excess electricity generation at certain times but a shortfall at other times. Creating separate pots could therefore ensure that different technologies, with less correlated generation, secure CfDs even if this may not lead to the lowest clearing strike prices overall. Figure 6 shows the correlation between different types of renewables.
Figure 6 Correlation in output between types of renewable generation
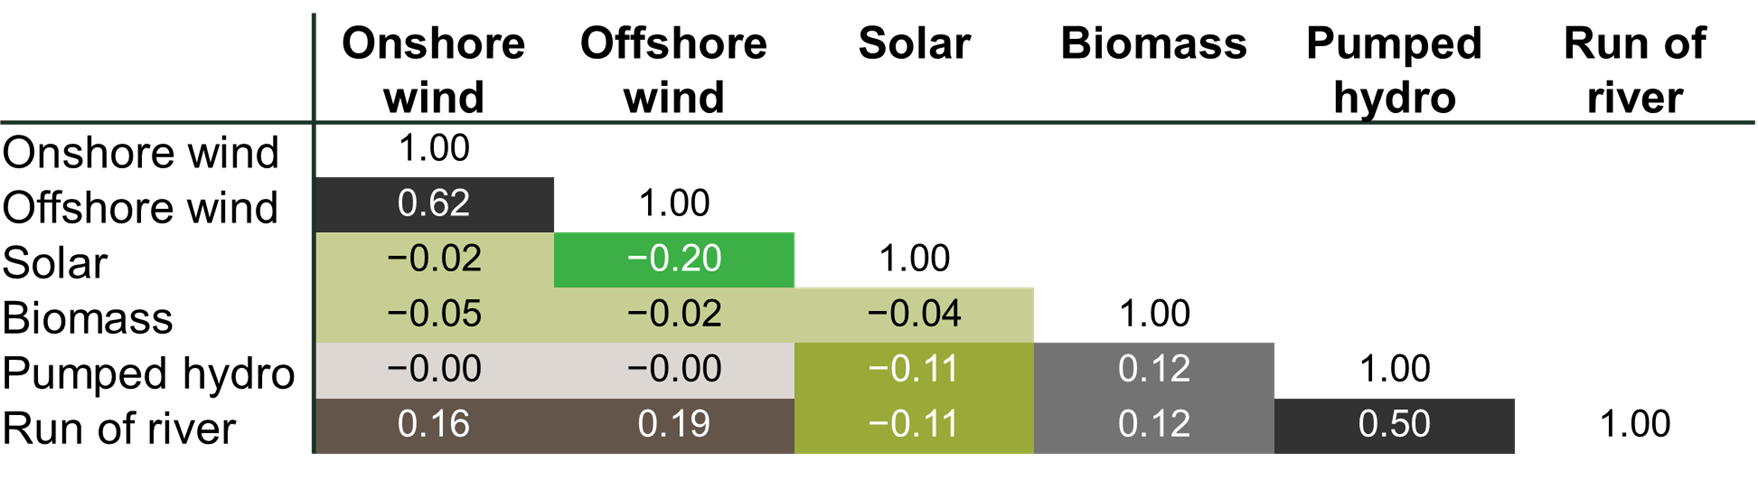
Source: Oxera analysis of generation data from the ENTSO-E ‘Transparency Platform’.
As expected, offshore and onshore wind are strongly correlated, and there is a weak negative correlation with solar generation. Most of the other technologies for which data was available show a very weak correlation. There are also a number of non-intermittent technologies eligible for CfDs (e.g. advanced conversion technologies, anaerobic digestion). While generation data was not available for these smaller technologies, the fact that they are not intermittent means that they would provide additional value to the system that is not necessarily priced into the corresponding bids. From a system perspective it might therefore be sensible to create different pots for technologies that are not correlated (or that are negatively correlated) to ensure diversity in the system.
Finally, the potential for long-term cost reductions plays an important role in the government’s auction design considerations. While current costs are reflected in the bids, there may be technologies that are more expensive at the moment but for which costs are expected to decrease over time, especially if they are rolled out at scale.22 With more cumulative capacity, costs for a specific technology are likely to decrease as the technology becomes more mature and supply chains are streamlined.23 This can also have an impact on other technologies, especially if they are closely related. For the design of the CfD pot structure, this means that policymakers should take into account how costs of different technologies are likely to develop given the projected scale of investment.
What does all this mean for the auction design of future CfD rounds?
There are significant cost differences between the current Pot 2 technologies, and particularly between offshore wind and some of the less mature generation types. Offshore wind generators have won the vast majority of CfDs so far (87% across all three auctions). Given the high resource potential of offshore wind, the less mature technologies are unlikely to win many CfDs if they are competing in the same pot as offshore wind. When deciding on the pot structure for the future auctions, the government therefore needs to strike a balance between the following objectives:
- the potentially lower strike prices if the less mature technologies are put in the same pot as offshore wind, rather than setting their own (more expensive) price in a separate pot;
- the need for CfDs in order to secure investment in certain renewable technologies at the scale that is required under the government’s decarbonisation scenarios;
- the system benefits of diverse generation technologies that are not reflected in CfD bids;
- the potential for long-term cost reductions from encouraging nascent technologies over established ones.
1 Department for Business, Energy & Industrial Strategy and the Rt Hon Chris Skidmore MP (2019), ‘UK becomes first major economy to pass net zero emissions law’, 27 June.
2 LCCC, National Grid ESO and BEIS, ‘Contract for Difference (CfD) Allocation Round 3 Resource Portal’.
3 LCCC, National Grid ESO and Department for Business, Energy & Industrial Strategy, ‘Contract for Difference (CfD) Allocation Round 3 Resource Portal’.
4 See Gov.uk (2020), ‘Contracts for Difference’, 2 March.
5 Department for Business, Energy & Industrial Strategy (2020), ‘Contracts for Difference for Low Carbon Electricity Generation: Consultation on proposed amendments to the scheme’, 29 May, p. 19.
6 There used to be a third pot dedicated to biomass conversion, but this was reallocated to Pot 1, in line with the state aid approval for the CfD scheme.
7 Department for Business, Energy & Industrial Strategy (2020), ‘Contracts for Difference for Low Carbon Electricity Generation: Consultation on proposed amendments to the scheme’, 29 May.
8 This simplified example is for illustrative purposes only and abstracts from further complications of the CfD auctions, such as different commissioning years and different generating capacities being taken into account in the process.
9 It might not always be the case that the cheapest generators on a per MWh basis are selected because the BEIS selection mechanism takes into account the size of the generators (i.e. total budget implication).
10 See for example Klemperer, P. (2002), ‘What really matters in auction design’, Journal of Economic Perspectives, 16:1, pp. 169−89.
11 Remote island wind costs are from different sources. See sources below Figure 4.
12 The LCOE is the discounted lifetime cost of building and operating a generation asset, expressed as a cost per unit of electricity generated (£/MWh). It covers all relevant costs faced by the generator, including pre-development, capital, operating, fuel and financing costs. Because the LCOE is expressed per unit of electricity generated, it can also be seen as the minimum constant electricity price the generator needs to earn over the lifetime of a project in order to break even.
13 According to BEIS, this is because the Dogger Bank projects won most of the CfDs in AR3, are larger than the reference plants, and benefit from better wind conditions. See Department for Business, Energy & Industrial Strategy (2020), ‘Electricity generation costs 2020’, August, p. 23.
14 For offshore wind, the resource potential could be up to 100 times more than current capacity. For onshore wind and solar, the estimates suggest that resource potential could be well over double the current capacity.
15 Osborne Clarke (2020), ‘The Energy Transition: National Grid’s new frequency response service, UK targets 40GW offshore wind by 2030 and Ofgem announces new electricity storage definition’, 9 October.
16 See, for instance, Aurora (2018), ‘Power sector modelling: System cost impact of renewables: Report for the National Infrastructure Commission’, May, p. 26; Pöyry (2011), ‘Analysing technical constraints on renewable generation to 2050’, March, Figures 5 and 7; Department of Energy & Climate Change (2011), ‘Review of the generation costs and deployment potential of renewable electricity technologies in the UK’, October, Figures 8, 10, 19 and 20; Vivid Economics (2019), ‘Accelerated electrification and the GB electricity system’, April, p. 47;
National Grid (2019), ‘Future Energy Scenarios 2019 Data WorkBook’, July.
17 HM Government (2019), ‘Industrial Strategy: Offshore Wind Sector Deal’, March.
18 Committee on Climate Change (2019), ‘Net Zero: Technical Report’, May, p. 36.
19 Oxera analysis for up to 2018, based on Re-Source (2018), ‘Innovation in Corporate Renewable PPAs’, 19 December.
20 See, for example, The Energyst (2019), ‘Banks “won’t lend on a merchant wind farm”’, 7 June.
21 In addition to the CfD scheme, some revenue certainty could be obtained through the capacity market. However, the capacity market aims to provide security of electricity supply by providing a payment for reliable sources of capacity. As most renewable technologies are intermittent—i.e. they cannot always be ‘switched on’—they can only provide firm capacity to a limited extent. The capacity market would therefore only compensate for a fraction of full capacity (around 1−2% for solar, 8−9% for onshore wind and 12−14% for offshore wind. See National Grid ESO (2019), ‘De-rating Factor Methodology for Renewables Participation in the Capacity Market’, 25 February, p. 3).
22 Newbery, D. (2017), ‘How to judge whether supporting solar PV is justified’, Energy Policy Research Group Working Paper, March.
23 It also may be the case that cost reductions are driven by global deployment levels. This means that a potential strategy could be to wait for other countries to roll out at scale, which would consequently drive down UK costs. In the case of offshore wind, the UK aims to be the front-runner, as evidenced by the sector deal. This means that other countries might ‘free-ride’ and benefit from the cost reductions resulting from a large-scale UK roll-out. However, the UK would benefit from building up know-how, investing in a UK supply chain and boosting exports.
Download

Related

Adding value with a portfolio approach to funding reduction
Budgets for capital projects are coming under pressure as funding is not being maintained in real price terms. The response from portfolio managers has been to cancel or postpone future projects or slow the pace of ongoing projects. If this is undertaken on an individual project level, it could lead… Read More

Consumer Duty board reports: are firms prepared for the July 2024 deadline?
The UK Financial Conduct Authority’s (FCA) Consumer Duty, a new outcomes-based regulation for financial services firms, has now been in force for over six months. July 2024 will see the deadline for the first annual Consumer Duty board reports. We share our reflections on the importance of these documents and… Read More