
A challenging initial assessment for the water companies in England and Wales
On 31 January, Ofwat published its Initial Assessment of Plans as part of the current water sector price control review in England & Wales. Ofwat categorised three companies’ business plans as ‘fast track’, meaning their proposals over 2020–25 are ready to implement. Four companies’ plans were categorised as needing significant scrutiny and substantial rework, and the remaining companies’ plans were categorised as ‘slow track’, needing to undertake further work on their plans. What are the cost-efficiency and finance aspects of this initial assessment?
At the end of January, Ofwat published its Initial Assessment of Plans (IAP), at what is a crucial juncture of the current price control review (PR19) in the England & Wales water sector.
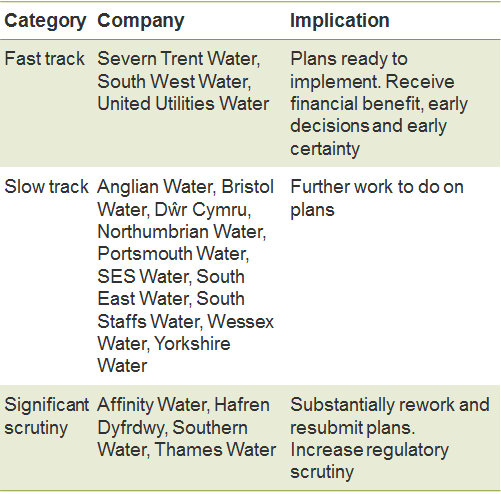
The IAP involved Ofwat assessing the strength of companies’ business plans, which were submitted in September 2018, across a number of test areas. Ofwat’s objective was to categorise the plans as ‘exceptional’, ‘fast track’, ‘slow track’, or requiring ‘significant scrutiny’. While four categories were possible in theory, only three were used in practice (with no company’s plan classed as ‘exceptional’). The outcome is summarised in Table 1.
Table 1 Ofwat’s IAP outcome
In turn, this overall categorisation was based on an assessment over nine test areas, the results of which are summarised in Table 2.
Table 2 Ofwat’s IAP outcome by test assessment area
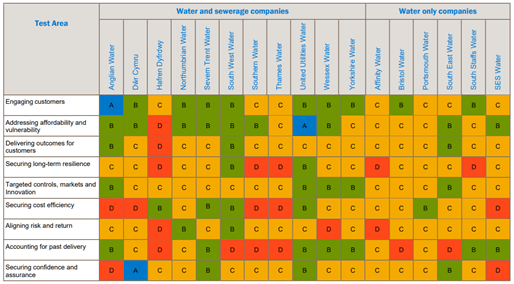
The relatively low grading on accounting for past delivery was primarily due to Ofwat’s view that more evidence was needed on the deliverability of improved performance over the next period. Low grading on securing long-term resilience was primarily due to Ofwat’s concerns around a lack of a systems-based approach to operational resilience or incomplete analysis, and/or issues around financial resilience. Most companies therefore need to submit further evidence on these areas.
However, two of the other key areas of the IAP were Ofwat’s view on aligning risk and return, and on securing cost efficiency for customers. We examine these two issues in turn below.
Aligning risk and return
In the risk and return section, Ofwat has assessed companies’ business plans across four categories:
- cost of capital and margins;
- risk analysis—return on regulated equity;
- financeability on a notional and an actual basis;
- proposed pay-as-you-go (PAYG) and regulatory capital value (RCV) run-off rates.
Moreover, in the securing confidence and assurance section, Ofwat assessed companies on compliance with the ‘Putting the sector back in balance’ consultation.1
Cost of capital and margins
The wholesale activities of water companies are regulated using a return on capital approach, whereas the more asset-light retail activities are regulated using assumed margins on turnover.
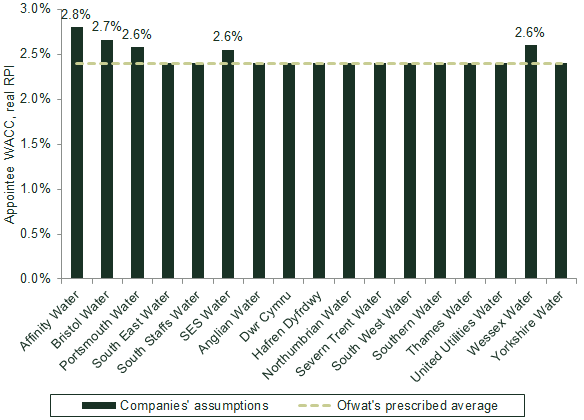
A crucial assumption underlying wholesale returns is the weighted average cost of capital (WACC), itself comprised of a mixture of assumed debt and equity financing. In this respect, 12 out of the 17 companies prepared their business plans using Ofwat’s initial estimate of WACC, which was published back in December 2017.2
However, as shown in Figure 1, not all companies did so. Among those that proposed alternative WACC estimates (Wessex, SES, Bristol, Portsmouth and Affinity), only Portsmouth was successful in arguing for an uplift to the WACC. In that specific instance, Ofwat accepted that the company should receive a small company premium (SCP) on the WACC, on the basis that the company had provided sufficient evidence to justify it.
Figure 1 PR19 appointee WACC, real RPI
Companies generally accepted Ofwat’s early view on retail margins.
Upside and downside risk analysis
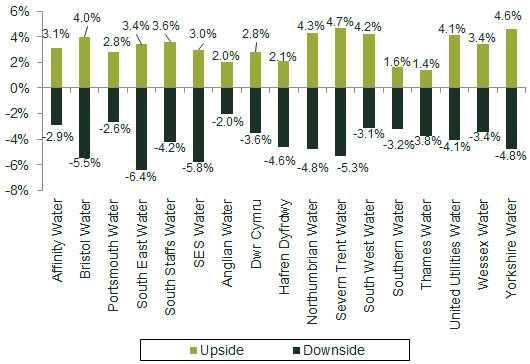
Companies were asked to present their expected upside and downside return on regulated equity (RORE) ranges during AMP7 (2020/21–2024/25), along with the potential risk management and mitigation measures to limit the downside.
Most companies performed well in this category. However, Ofwat challenged companies for presenting negatively skewed expected RORE and total expenditure (TOTEX) ranges (see Figure 2). In Ofwat’s view, companies had much more potential to outperform than the submitted RORE analysis had suggested.
Moreover, Ofwat also challenged companies that, based on the RORE analysis, had also proposed bespoke uncertainty mechanisms to allow for more risk-sharing with customers once prices had been set.
Figure 2 RORE ranges
Financeability
Ofwat does not just look at the appropriate WACC in setting allowed revenues for companies at periodic reviews; it also considers whether the package, once determined, is ‘financeable’. In their business plan submissions, it was for companies to demonstrate this in the first instance.
In this regard, in the IAP Ofwat looked at both the notional and the actual capital structure of each company, requiring each one to demonstrate that its plan was financeable on both a ‘notional’ and an ‘actual’ basis.
One of Ofwat’s key concerns is that some companies have targeted a Baa2 credit rating (i.e. one notch above investment grade) in their financeability assessment. Ofwat has challenged them to target—and comfortably reach—Baa1 (i.e. two notches above investment grade).
In the IAP, Ofwat has assessed financeability under the notional capital structure ‘in the round’, instead of putting all the emphasis on the thresholds of credit rating metrics as determined by credit rating agencies.
The degree to which forecast TOTEX is added to the RCV, versus being remunerated up front in price limits, can be adjusted to affect the financeability of water companies. In practice, both the pay-as-you-go ratio and RCV run-off rate can be adjusted—although these are not the only tools (for example, the WACC might also be adjusted).
In these respects, where financeability constraints existed, Ofwat favoured the following approach in its IAP.
- The adjustment of PAYG and run-off rates was viewed as preferable to increasing the cost of equity to manage notional financeability; however, PAYG or RCV run-off rates were not seen as appropriate to address a financeability constraint related to actual financeability.
- It was not seen as relevant that rating agencies, in practice, ignore the impact of changing PAYG and run-off rates when calculating their rating metrics.
- Advancing cash flow will not be allowed to address financeability under the actual capital structure, but assumptions about equity injections will be allowed to address financeability under the notional capital structure (where a company has a particularly large investment programme relative to its RCV).
PAYG and RCV run-off
Ofwat was largely content with the evidence provided by most of the companies on their PAYG rates. However, it noted that most companies did not provide sufficient evidence to demonstrate that the RCV run-off rates were estimated correctly in line with the PR19 methodology.
In general, Ofwat has decided not to intervene in bill profiling due to the migration from RPI to CPIH (UK measures of inflation), as long as companies provide evidence that customers are on board with the bill profiling.
Putting the sector back in balance
Ofwat also assessed companies in terms of their compliance with its ‘Putting the sector back in balance’ consultation.3 In that consultation, companies were asked to adjust their financial structures (including reducing of gearing if above 70% and sharing any financing outperformance benefits with customers), dividend policies and executive compensation to bring these in line with customer interests.
According to the regulator’s subsequent IAP assessment, most of the companies were not fully compliant in this category. For instance, two of the highest-geared companies (with gearing above 70%) did not adopt Ofwat’s benefit-sharing mechanism; while most companies proposed nominal base dividend yields of below 5%, in line with the consultation, no company fully met all the expectations on dividend policies or executive remuneration policies.
Ofwat has asked companies that proposed to reduce gearing below 70% over PR19 to provide a clear plan and commitment from investors.
Securing cost efficiency
Another key issue in the IAP is the ‘securing cost efficiency’ category. Before exploring the details, it is interesting to see how the outcome at the PR19 IAP compares with that at an equivalent point at PR14, the risk-based review (RBR).
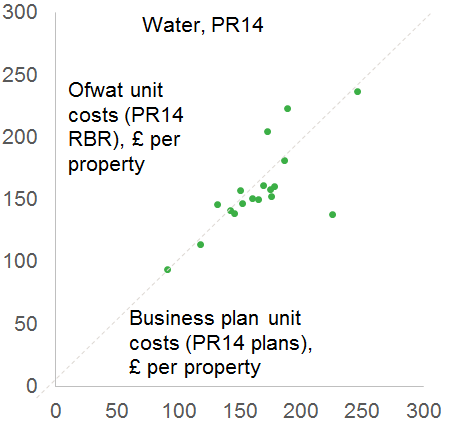
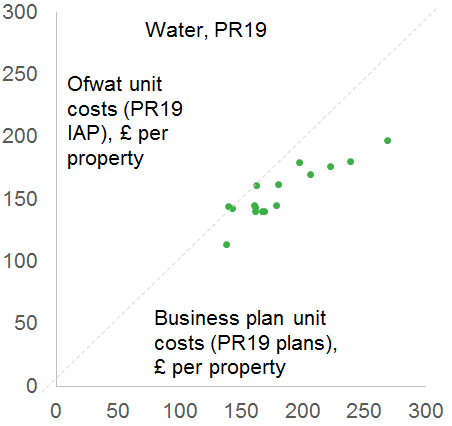
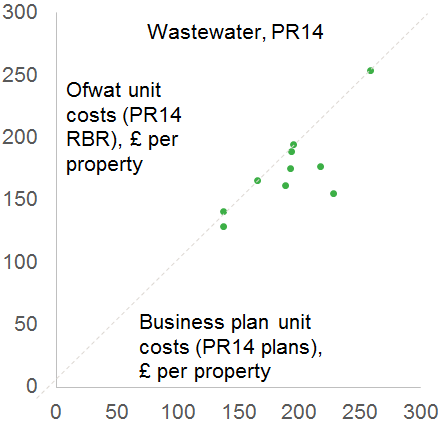
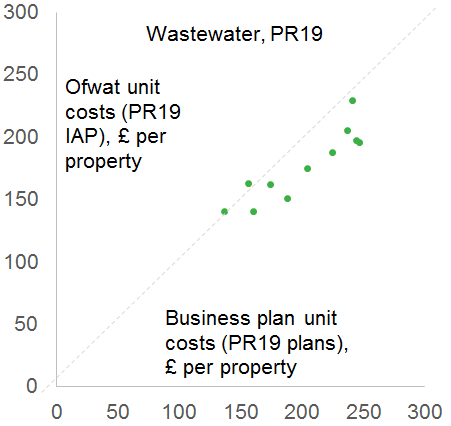
Figure 3 shows how the cost assessment outcomes differed between business plan submissions and the IAP at PR14 and PR19 by company.4 The horizontal axis shows the TOTEX per property submitted by companies, while the vertical axis shows the TOTEX per property from Ofwat’s cost assessment models at PR14 and PR19 for water and wastewater. If Ofwat’s assessment is equivalent to companies’ submissions, companies would be placed on the diagonal dashed line. Companies placed below the 45-degree line and towards the bottom and right have a larger efficiency challenge.
The cost gap on water has been particularly large for companies at this price review, relative to PR14. (Indeed, the figure shows that at PR14, the leading companies’ efficient cost level, as assessed by Ofwat, was above that submitted by the companies in their business plans). The level of challenge on wastewater is roughly equivalent across the two price reviews, although there are fewer companies with a challenge close to zero at PR19.
Figure 3 Business plan unit TOTEX against IAP, PR14 RBR compared with PR19 IAP
The overall approach
Although the water sector now operates under a ‘TOTEX regime’, in the area of cost efficiency, Ofwat has used different approaches for different cost areas to assess companies’ business plan wholesale costs:5
- wholesale base expenditure, BOTEX (operating expenditure and capital maintenance)—econometric modelling of historical costs, with an upper-quartile catch-up challenge based on historical performance;
- wholesale enhancement expenditure—assessment of individual enhancement scheme based on a combination of econometric, unit cost and qualitative assessment, with an upper-quartile, average or median catch-up challenge depending on the area.
Although the previous review, PR14, introduced a TOTEX regime to the sector and included TOTEX modelling, for PR19, Ofwat and the industry have found it difficult to reliably model TOTEX.6 This separation of the cost base and the different approaches used within each category does mean that, in practice, companies can be better or worse off depending on (i) the choice of base or enhancement solutions, and (ii) cost allocation/operational trade-off issues.
We now consider Ofwat’s approach to assessing the efficient cost level in each of the main cost areas. Below, we refer to three periods considered by Ofwat in its modelling:
- the historical period (2011/12–2017/18);
- the recent historical period (2013/14–2017/18);
- the PR19 or forecast data (2020/21–2024/25).
Base expenditure
Ofwat’s approach to assessing wholesale base expenditure involves the following steps.7
- Estimate the cost to cost-driver relationships using econometric modelling over the historical period.8
- Using these relationships and Ofwat’s forecast of company cost drivers with some company-specific adjustments (rather than those submitted by companies in their business plans), predict costs over AMP7 using the average across model results.
- Adjust these cost projections using the upper quartile based on data from the recent historical period.
- Overlay a 1.5% p.a. net frontier shift efficiency challenge (i.e. frontier shift and input price inflation).
- Add efficient cost adjustment claims and unmodelled costs.
Ofwat’s approach on retail expenditure (which is primarily base expenditure) involves the following steps.9
- Estimate the cost to cost-driver relationship using econometric modelling of the historical period.
- Using these relationships and Ofwat’s or the company’s forecast of company cost drivers, predict costs over AMP7 using the average across model results.
- Adjust these cost projections over AMP7 using the upper quartile based on the forecast data.
- No explicit net frontier shift efficiency challenge overlay is applied, given the use of the forecast (or forward-looking) upper quartile.
- Add efficient cost adjustment claims (if any) and unmodelled costs.
It is clear from the above that there is an inconsistency between the wholesale modelling approach and the approach for retail—in particular, there is a discrepancy in the choice of period to use in order to assess the upper-quartile efficiency challenge. This choice makes a significant difference for retail cost allowance as the five leading companies project cost reductions of 33% over the future period, compared with 16% for the industry as a whole. This 33% reduction is driven primarily by a projected reduction in bad debt. Therefore, it seems likely that the choice of period over which the efficiency benchmark is derived will be a source of discussion over the next few months.
Enhancement expenditure
Within the PR19 IAP, Ofwat’s approach to assessing wholesale enhancement expenditure involved the following steps.10
- Each area of enhancement expenditure (e.g. supply and demand, growth, metering, resilience) was assessed separately.
- A comparative assessment (using unit cost or econometric models) was undertaken where possible. If a modelling approach was not possible, Ofwat reviewed the cost area using a technical assessment on a case-by-case basis.
- Models were estimated either over the forecast period only or over a combination of forecast and historical periods, depending on the area.
- Using the cost to cost-driver relationships and generally Ofwat’s own forecast of company cost drivers, costs were predicted over PR19 using the average across model results.
- Company performance was benchmarked to the upper quartile, average or median of performance over the forecast period.
- For each area of expenditure, Ofwat adopted the minimum of its modelled result and companies’ business plan expenditure.
- The benchmarked individual scheme results were then aggregated to the overall enhancement expenditure level.
- No net frontier shift efficiency challenge overlay was applied, given the use of forecast benchmarks.
This model is simple compared with the one used to assess base expenditure. It often includes only one cost driver. Given the idiosyncratic nature of enhancement expenditure and the simplicity of the models, the range of efficiency scores that result from this modelling are particularly wide (e.g. for flow to full schemes expenditure, the range of efficiency scores is 59–291%).
As such, further thought may need to be given on the appropriateness of the choice of various benchmarks (such as upper quartile, in the case of flow to full schemes). Moreover, prior to aggregation, the use of the minimum of the model results and the companies’ business plan expenditure will exacerbate cost allocation/operational trade-off issues (as these will no longer net off when aggregating) and can have a disincentive effect on companies submitting ambitious cost projections.
Frontier shift and input price inflation
In addition to relative efficiency, Ofwat also accounts for technological improvements or frontier shift for base expenditure. Ofwat develops its frontier shift assumption based on the following two studies.11
- Long-term technological rates of improvement—as measured by total factor productivity (TFP) in various sectors. The TFP growth performance of the stronger-performing comparator sectors prior to the financial crisis is used to set the upper bound, which ultimately represents Ofwat’s choice.
- One-off efficiency due to the move to a TOTEX and outcomes framework. This study examines the incremental increase in outperformance in the control period after introducing a TOTEX and outcomes framework (as used by Ofwat in PR14 and PR19).
As a result, Ofwat assumes a frontier shift of 1.5% p.a. This is based on a 1% p.a. frontier shift plus a further 0.5% p.a. from the incremental benefit of the TOTEX regime, although the rationale for the exact split has not been explained.
With regard to the first assumption, it is notable that the 1% p.a. figure is higher than assumptions used in previous water price control reviews, probably due to the choice of the TFP performance of the higher-performing sectors. On the second assumption, it is worth noting that outperformance can be due to myriad drivers (including the regulator’s own assumptions at the price control), only one of which is efficiency—so it is unclear what has driven the figure.
Real input prices (such as real wage growth) potentially offset frontier shift improvements. Ofwat also commissioned work examining this issue.12 This analysis concluded that input price inflation in the water sector was equivalent to a general economy-wide inflation measure, CPIH. The reasoning for this was partly driven by the observed input price inflation over the recent historical period. Again, it is notable that such an assumption is more stringent than in previous reviews. It appears particularly challenging when, after a significant period of stagnation since the financial crisis, forecasts for input price inflation, such as real wages, are positive for the UK economy.
Concluding observations
Companies have until 1 April to resubmit their business plans and evidence. As per the last review, it is likely that there will be some significant convergence in the efficient cost level gap by the time of the draft determinations for a number of companies. As such, there is still time (although a relatively small amount) for companies to reduce the current gap by producing more compelling evidence bases, as well as by reconsidering their own plans.
Similarly, the IAP only represent Ofwat’s initial assessment. As such, it is likely that there are a number of elements of Ofwat’s analysis that will change come the draft determinations, which are due to be published in April for fast-track companies and in July for all other companies. The coming months will be very busy in the sector.
1 Ofwat (2018), ‘Putting the sector back in balance – summary of Ofwat’s decision on issues for PR19 business plans’, 18 July.
2 Ofwat (2017), ‘Delivering Water 2020: Our final methodology for the 2019 price review’, 13 December.
3 Ofwat (2018), ‘Putting the sector back in balance – summary of Ofwat’s decision on issues for PR19 business plans’, 18 July.
4 The data for PR14 is taken from Ofwat’s risk-based review (RBR).
5 Ofwat (2019), ‘Technical Appendix 2: Securing Cost Efficiency’, January. Separately, Ofwat uses econometric modelling of forward-looking business plan costs to assess residential retail expenditure.
6 Although Ofwat will reconsider this issue going forward and may include elements of enhancement spend within BOTEX econometric models in future reviews.
7 Ofwat (2019), ‘Initial assessment of business plans – cost assessment models’, January.
8 On water, Ofwat has modelled overall base TOTEX as well as functional activities separately; on wastewater, Ofwat has only modelled functional activities, the results of which are modelled to overall base TOTEX.
9 Ofwat (2019), ‘Initial assessment of business plans – cost assessment models’, January.
10 Ofwat (2019), ‘Initial assessment of business plans – cost assessment models’, January.
11 Europe Economics (2019), ‘Real Price Effects and Frontier Shift’, January; KPMG and Aqua Consultants Ltd (2018), ‘Innovation and efficiency gains from the totex and outcomes framework’, June.
12 Europe Economics (2019), ‘Real Price Effects and Frontier Shift’, January.
Download

Related

Adding value with a portfolio approach to funding reduction
Budgets for capital projects are coming under pressure as funding is not being maintained in real price terms. The response from portfolio managers has been to cancel or postpone future projects or slow the pace of ongoing projects. If this is undertaken on an individual project level, it could lead… Read More

Consumer Duty board reports: are firms prepared for the July 2024 deadline?
The UK Financial Conduct Authority’s (FCA) Consumer Duty, a new outcomes-based regulation for financial services firms, has now been in force for over six months. July 2024 will see the deadline for the first annual Consumer Duty board reports. We share our reflections on the importance of these documents and… Read More