
Has market fragmentation caused a deterioration in liquidity?
The EU equity trading markets have seen significant changes in their structure in the last decade. The introduction of competition among trading venues following MiFID has resulted in lower trading fees and greater choice for end users. However, concerns have been raised about trading fragmentation leading to liquidity fragmentation. Have the markets indeed become ‘thinner’, and have the actual costs of trading for end-users increased as a result?
This article is part of a series of articles on primary and secondary equity markets in the EU, based on research conducted by Oxera for the European Commission. For Oxera’s final report, see Oxera (2020), ‘Primary and secondary equity markets in the EU’, report prepared for the European Commission, September.
In 2007, the Market in Financial Instruments Directive (MiFID) framework introduced competition in equity trading. Since then, alternative trading venues have emerged that compete with the regulated markets for order flow by tailoring trading mechanisms to the needs of different types of equity trader.1
The increased competitive pressure has resulted in lower trading fees, new service propositions tailored to the specific needs of traders and investors, and greater choice for end users overall. However, already when MiFID I was being implemented, there had been a concern that trading fragmentation could result in liquidity fragmentation and higher implicit costs of trading, as it may become more difficult for market participants to search for liquidity across multiple venues.2 Some buy-side and sell-side market participants have indeed raised concerns about the market having become ‘thinner’,3 and that the actual costs of trading may be much higher than indicated by bid–ask spreads alone.
Oxera’s report for the European Commission is the first to conduct a comprehensive analysis of liquidity trends using a range of liquidity metrics across EU markets, including both large and small financial centres. The analysis covers an entire decade, from 2009 to 2019, allowing us to observe both long-term and more recent trends in these markets. Our analysis therefore contributes to the existing literature on liquidity trends and the impacts of fragmentation on liquidity in equity markets.4
How do we measure liquidity?
Liquidity has always been a popular topic for debate among market participants, regulatory authorities and academics who have a wide range of views on the matter.
On the one hand, a liquid market enables participants to buy and sell securities of any reasonable order size for similar prices without delay and without a significant impact on prevailing prices. Less liquid (or illiquid) assets are associated with high implicit costs of executing trades. Therefore, a low level of liquidity leads to higher total trading costs for market participants, and can potentially increase the cost of capital for firms seeking to raise funds in public markets.
On the other hand, proponents of long-term investing, rather than trading on short-term market movements, would argue that there is such a thing as too much liquidity.5 The excessive liquidity in stock markets, especially for very niche securities, can even lead to financial turbulence and economic recession.6
Given the complex and multifaceted nature of liquidity, there are various metrics to gauge the liquidity of a market. While we consider multiple liquidity metrics, such as trading volume, turnover, and bid–ask spread in the report (see Table 1), we focus our attention on the implementation shortfall metric.
As a comprehensive measurement of liquidity, implementation shortfall captures the actual implicit costs of trading for end-investors, including the prevailing spreads and price impacts of executing the trades.7 Price impacts quantify the ability of a market to absorb the execution of large orders without the price moving significantly, and thus can be a major component of implicit costs, especially for these large orders.
Implementation shortfall is defined as the difference between the price actually achieved for an investor’s trade and the last price obtained in that security prior to the investor starting to buy (or sell) it. For example, if an investor bought a security at the price of £100.35, and the last price prior to this trade was £100, then the implementation shortfall would be £0.35 or 35bp.
Table 1 Summary of liquidity dimensions and metrics
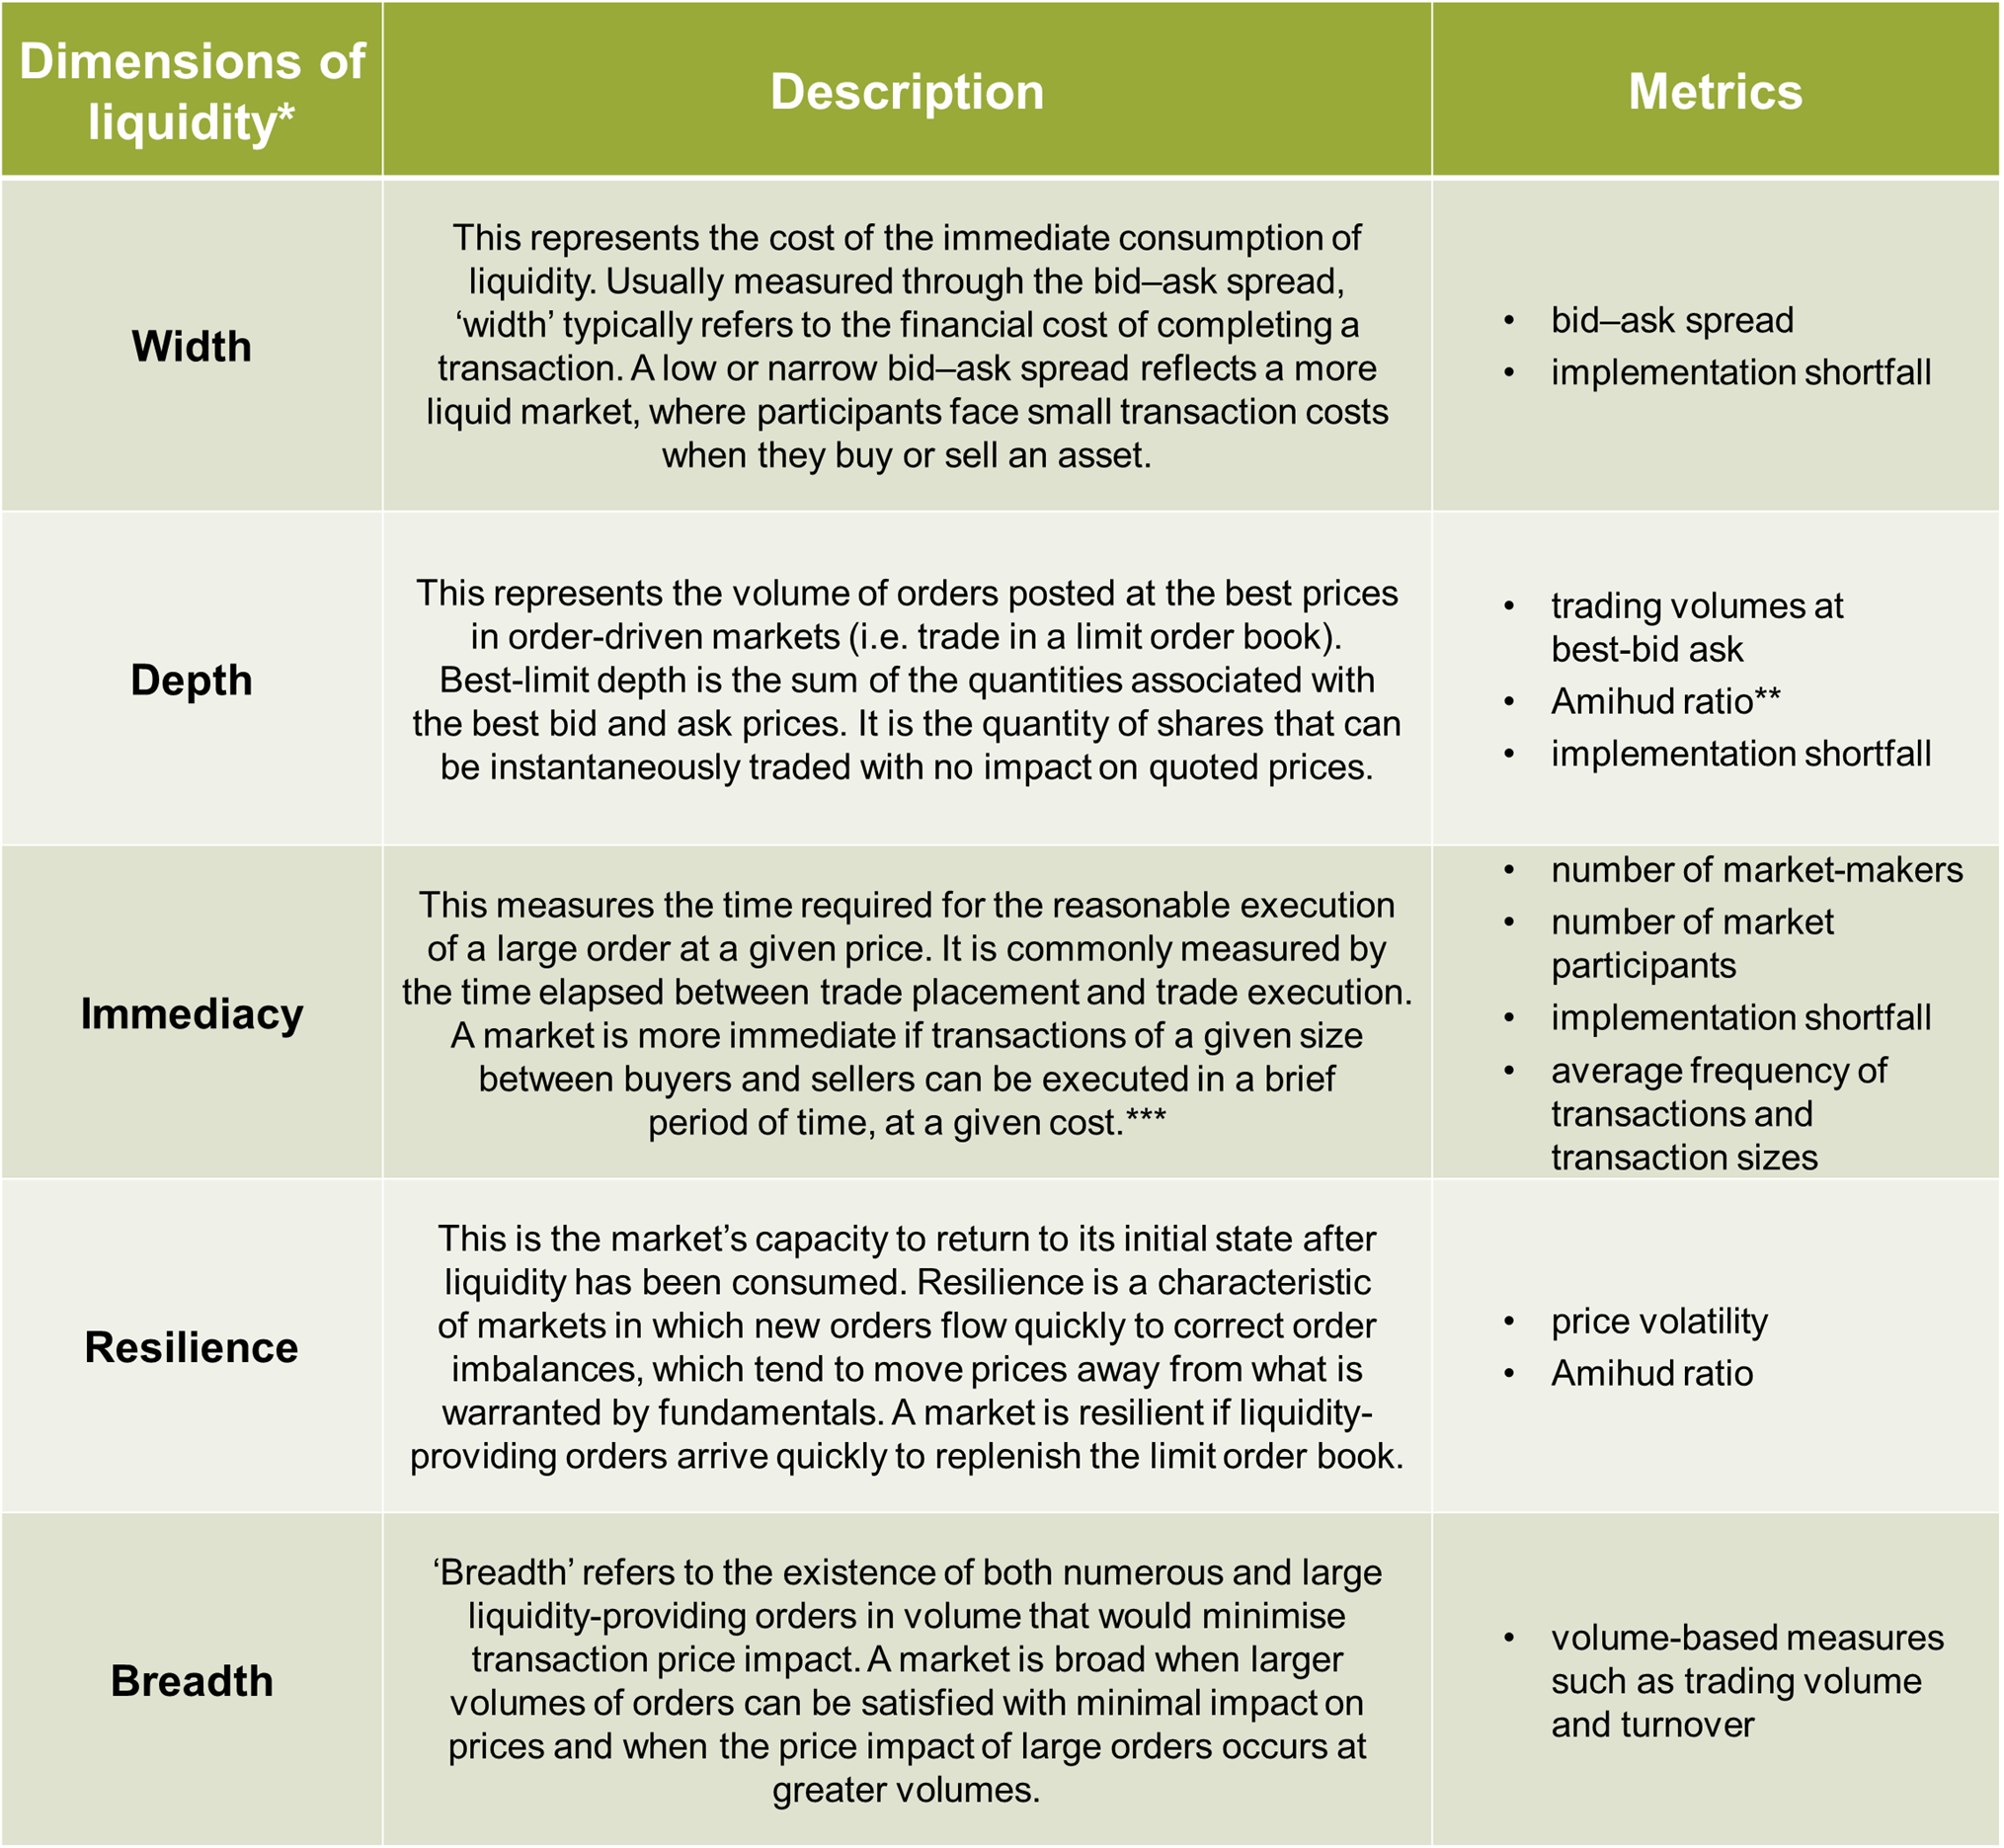
*** Based on the definition of immediacy in Autorité des marchés financiers (2019), ‘Measuring Liquidity on the Corporate Bond Market’, March; and Hachmeister, A. (2007), ‘Informed traders as liquidity providers: evidence from the German equity market’, Springer Science & Business Media, 66.
Source: Oxera (2020), ‘Primary and secondary equity markets in the EU’, report prepared for the European Commission, September, Appendix A9.
Has liquidity deteriorated over time?
The bid–ask spread averaged across the EU has reduced significantly over the ten-year period from 2009 to 2019.8 However, various market participants have pointed out that while the bid–ask spread has narrowed, market depth—the volume of orders posted at the best prices—may have also reduced, due to market fragmentation. That means that the implicit costs of trading large orders could be much higher than suggested by bid–ask spread.
There is indeed evidence that the market has become ‘thinner’; but our analysis shows that the overall impact on liquidity is still positive. Our trend analysis shows a reduction of implementation shortfall at the aggregate European level, which is consistent with bid–ask spread results. Nevertheless, the implementation shortfall has improved less significantly than the bid–ask spread. This is indeed likely to reflect the countervailing impact of a reduction in market depth and immediacy, which are not captured when measuring bid–ask spreads.
Our findings are consistent with insights from our interviews with market participants and academic literature on the topic.9
Summary findings from industry reports and academic literature
The UK Financial Conduct Authority finds that market depth for the FTSE100, as well as Euronext Paris and the NYSE, was relatively stable between 2012 and 2015. In addition, the analysis shows that the three peer markets (France, the UK and the USA) had observed that trading costs, and more specifically price impacts, have reduced during the period studied.1
A 2019 Blackrock report provides further evidence that transaction costs have reduced in both European and US equity markets from 2009–14. The report concludes that developments in equity markets—such as electronification, increased competition, new market participants, and the development of ETFs—have benefited end investors through deeper and more liquid equity markets.2
A significant number of liquidity studies find an improvement in the liquidity of equity markets. These studies use various metrics of liquidity, from a simple bid–ask spread, price impact, quoted and effective spreads, to proprietary metrics produced by stock changes. Others have found, in general, no impact or positive impacts of market fragmentation on liquidity. For a detailed review of the existing literature, see Appendix A10.1 of the Oxera report.
Note: 1 See Financial Conduct Authority (2016), ‘UK equity trading costs continue to decline’, Insight, 2 November. 2Blackrock (2019), ‘Mark-to-market structure: An end-investor perspective on the evolution of developed equity markets’, February.
Source: Oxera (2020), ‘Primary and secondary equity markets in the EU’, report prepared for the European Commission, September, Appendix A10.1.
While our main dataset covers the 2009–19 period and is therefore likely to capture some of the impacts from the global financial crisis, we find a similar pattern in implementation shortfall over a longer time period from 2004 to 2019. However, the reduction in the implementation shortfall across the EU is of a smaller scale. The USA follows a similar trend, but has exhibited a slightly lower implementation shortfall in more recent years.
Figure 1 Implementation shortfall trends, 2004–19 (bp)
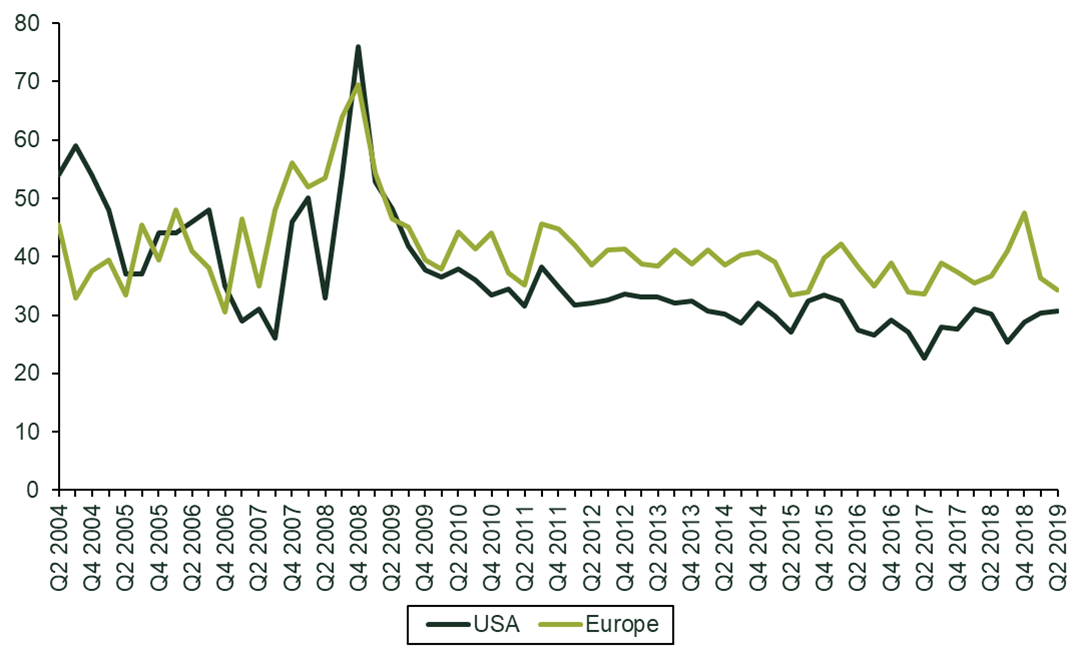
Source: Q2 2004 to Q4 2008: Investment Technology Group (2009), ‘Global Cost Review Q2 2008’, pp. 1, 4 and 5; Q2 2009 to Q2 2019: ‘Virtu Global Peer database’.
What can explain the trends in liquidity?
As explained in the academic literature, market fragmentation should not lead to a worsening of liquidity, compared to having one consolidated order book, as long as the following two conditions hold:10
- investors can multi-home (i.e. access multiple trading platforms simultaneously) easily and/or at low cost;11
- search costs for investors (i.e. the cost of identifying the strategy to execute their order at the best possible price) are low.
The increasing popularity of multilateral trading facilities (MTFs) and other trading venues shows that the set-up costs have been reduced significantly. It also shows that there is a considerable amount of multi-homing, with market participants having a wide range of venues on which to execute their trades according to their specific priorities.
In addition, the use of a smart order routing (SOR) system allows traders in the EU to search for the best available opportunity across a range of trading venues. While the up-front fixed costs of such systems are not insignificant and may only be suitable for large trading/brokerage firms, SOR helps lower search costs for end-investors.12 Therefore, as long as there is sufficient pre- and post-trade transparency, in principle, all platforms can form one pool of liquidity with the help of technology.13
Our finding that liquidity at the aggregate EU level has been at least stable in recent years, or in some cases has improved, is therefore consistent with the existing literature.14 Insights from our interviews with market participants indicate that traders navigate a somewhat reduced market depth in different ways—for example, seeking out alternative non-lit trading mechanisms and breaking large trade orders up into smaller ones.
Despite the challenges and higher implementation and IT infrastructure costs of maintaining market fragmentation, both the EU and the US markets have showcased how a competitive model can work, not only delivering benefits from lower explicit trade execution costs driven by strong competition among trading venues, but also maintaining sufficient liquidity.
Besides the increased competition among trading venues, it is important to note other drivers that contribute to the post-2009 trends in liquidity. For instance, increased computing power has given rise to algorithmic trading, including high-frequency trading (HFT). HFT is generally associated with tighter bid–ask spreads and more efficient price formation, but it has also led to fundamental changes in equity trading, including a significant reduction in trade size and concerns about lower market depth. Furthermore, the reduction in proprietary trading by banks, as a result of stronger regulations and banks’ lower risk tolerance following the 2008 financial crisis, has meant lower market-making activities, which would have negative impacts on liquidity.
Policy considerations
Our analysis shows that liquidity at the aggregate EU level has been stable in recent years, indicating that concerns about the market having become thinner are not entirely justified.
However, two areas of concern remain.
- Although the gap between the liquidity in the USA and Europe has narrowed in recent years, there may be room for further reductions in the implicit costs of trading for large-cap stocks in Europe—in particular, for those from large financial centres, which have been exposed to the highest level of venue competition and the most significant technological improvements, but whose implicit costs of trading mostly remain unchanged.
- Various segments of the EU equity markets are still experiencing low levels of liquidity—more specifically, small and medium-sized enterprises (SMEs) and smaller financial centres in the Central and Eastern European region.
Our study identifies several key policy areas aimed at improving overall liquidity in the EU, especially for SMEs and small financial centres. These include: (i) encouraging more institutional investment and anchor investors into local capital markets; (ii) supporting the development of the pan-European infrastructure and ecosystem; (iii) promoting more investment in SMEs, such as creating fund structures that facilitate investment in SMEs; and (iv) building further public trust in equity through strengthened corporate governance.
It is also important to note that liquidity is a complex concept that consists of multiple dimensions, such as market breadth, width, depth, and immediacy. To understand the liquidity performance and have a well-rounded view of market development in this area requires regular and consistent monitoring of liquidity across EU markets. To capture the multidimensional nature of liquidity therefore means that monitoring would need to consider a wide range of metrics, including more comprehensive measures such as implementation shortfall.
1 Furthermore, MiFID II in 2018 introduced further rules, including revisions to the transparency regime, tick sizes, a cap on dark trading, and share trade obligations, all of which have affected the trading choices of market participants.
2 For example, Goldman Sachs reports a deterioration in market depth, measured by liquidity at touch, in its ‘EMEA Market Structure – June & Q2 2019 Update’.
3 Ibid.
4 The impact of market fragmentation on liquidity continues to be a hot topic for academic research, with a well-established literature: see, for example, O’Hara, M. and Ye, M. (2011), ‘Is market fragmentation harming market quality?’, Journal of Financial Economics, 100:3, pp. 459–74; and Gresse, C. (2017), ‘Effects of lit and dark market fragmentation liquidity’, Journal of Financial Markets, February, pp. 1−20.
5 For example, Paul Volcker, Former US Federal Reserve Chairman, remarked that ‘[bond liquidity] is important, but there is such a thing as too much liquidity’: see Imbert, F. (2015), ‘No, there is no liquidity problem in bonds: Paul Volcker’, CNBC, 30 July. In his 1983 Berkshire Hathaway annual letter, Warren Buffet wrote: ‘One of the ironies of the stock market is the emphasis on activity. Brokers, using terms such as ‘marketability’ and ‘liquidity’ sing the praises of companies with high share turnover (those who cannot fill your pocket will confidently fill your ear). But investors should understand that what is good for the croupier is not good for the customer. A hyperactive stock market is the pickpocket of enterprise’. See Grocer, S. (2015), ‘50 Years of Berkshire Annual Letters: Here are Some Highlights’, Wall Street Journal, 28 February.
6 See Chu, L. K. and Chu, H. V. (2020), ‘Is too much liquidity harmful to economic growth?’, The Quarterly Review of Economics and Finance, 76, pp. 230–42.
7 Implementation shortfall would also capture any in-trade price momentum. This means that if the stock momentum is positive (i.e. moving in a beneficial direction for the trader, such as ‘price goes up while you sell’), the momentum can offset the other cost components, and the final achieved price will be greater than the arrival/starting price for sells, and less for buys.
8 The bid−ask spread averaged across the EU has reduced from 23.3bp in the first half of 2009 to 7.1bp in the first half of 2019.
9 In addition to the relevant empirical sources, our findings have been informed by discussions with key stakeholders and market participants. On 19 November 2019, we hosted a roundtable in Brussels on the future of equity markets. The participants included a number of leading CEOs, Board members and leading market experts. The insights from the discussion are incorporated throughout our report. Alongside the Brussels roundtable event, we conducted a large number of structured interviews with market participants, including buy-side participants, brokers, and market infrastructure providers such as stock exchanges.
10 See Foucault, T. and Menkveld, A. J. (2008), ‘Competition for Order Flow and Smart Order Routing Systems’, Journal of Finance, 63:1, pp. 119–58; and De Fontnouvelle, P., Fishe, R. P. and Harris, J. H. (2003), ‘The Behavior of Bid‐Ask Spreads and Volume in Options Markets during the Competition for Listings in 1999’, Journal of Finance, 58:6.
11 Multi-homing is where users can use more than one platform simultaneously.
12 This is because it relies on defined rules, configurations and algorithms to look for the best prices available.
13 See a more detailed discussion on the costs and benefits of introducing competition between stock exchanges in Oxera (2012), ‘Introducing competition between stock exchanges: the costs and benefits’, November.
14 See Appendix A10.1 in our report for our review of the existing literature.
Download

Related

Adding value with a portfolio approach to funding reduction
Budgets for capital projects are coming under pressure as funding is not being maintained in real price terms. The response from portfolio managers has been to cancel or postpone future projects or slow the pace of ongoing projects. If this is undertaken on an individual project level, it could lead… Read More

Consumer Duty board reports: are firms prepared for the July 2024 deadline?
The UK Financial Conduct Authority’s (FCA) Consumer Duty, a new outcomes-based regulation for financial services firms, has now been in force for over six months. July 2024 will see the deadline for the first annual Consumer Duty board reports. We share our reflections on the importance of these documents and… Read More