
Economic profitability in banking and the (mis)allocation of capital
Many banks make capital allocation decisions using the same profitability hurdle rate for all business units. Does that matter? We look at how this practice could lead to distortions at the business unit level, with potentially important consequences for shareholders, competitors and consumers.
Given the wave of new regulation since the global financial crisis that began in 2007, it is now more important than ever for banks to allocate their scarce capital efficiently across their business units. New regulations (such as Basel III and Basel IV) require banks to hold more and higher-quality capital. Structural change in recent years—particularly the introduction of ring-fencing for UK banks—has placed new restrictions on where capital is held in the business.
Banks perform many activities and, as with any company offering multiple products or services, the risk profile varies across the business. Finance theory dictates that the cost of capital should vary across business units to reflect their different levels of risk. For a bank, the amount of capital allocated to a business unit is one of the main determinants of measured profitability. Reforms to capital requirements have therefore refocused attention on business-unit profitability, and have caused banks to adjust their strategies and product mixes.1
The UK Financial Conduct Authority (FCA) is examining the cost of capital as part of its Strategic Review of Retail Banking Business Models. The most recent progress report mentions the cost of capital as one area where further investigation is required to better understand the economic profitability of different retail banking business models.2 Oxera assisted the FCA with formulating its approach to the review. The information set out in this article and conclusions drawn are entirely those of Oxera and do not necessarily reflect the opinion of the FCA.
The Bank of England’s latest Quarterly Bulletin also discusses this issue, noting that some banks use the same profitability hurdle rate for all business units, whereas others use different rates.3 Does this matter? It can lead to distortions at the business unit level, with potentially important consequences for shareholders, competitors and consumers. In this article we set out why.
Theory—determining hurdle rates for bank business units
On an optimal balance sheet, capital should be allocated such that the last marginal increment of the bank’s capital generates the same profits on a risk-adjusted basis regardless of which business unit it is deployed in.4
The projected returns of a business unit (or product line) are usually assessed against a hurdle rate. Typically, this rate is set by the treasury department of the business and is equal to the minimum expected return of an investment. The standard approach to measuring hurdle rates comes from the concept of opportunity cost. What return would a shareholder have obtained from an alternative investment of similar risk?
Modern Portfolio Theory5 suggests that this rate (also called the cost of capital) is the rate of return required by a diversified investor, and that it varies according to the covariance between the expected cash flows to the shareholders of the business and the returns of the market. A common reference point for the required return of an investment is the capital asset pricing model (CAPM).
The CAPM is based on the notion that investors require a premium (i.e. a higher return) to invest in equities relative to a risk-free investment. For any given asset, the size of this premium can be calculated as the product of:
- the required equity risk premium for the market as a whole; and
- a measure of how correlated the returns on that particular asset are with the returns on the market as a whole (the ‘equity beta’).
The equity beta captures the market risk of an asset—the higher the equity beta, the more responsive is the expected value of the asset to movements in the overall market. The equity beta varies depending on leverage. The asset beta measures market risk excluding the effects of leverage.
Typically, one would expect the cash flows from different units of a business to have different levels of risk, and therefore to require different rates of return. For banks the situation is more complex, as equity capital is allocated to these activities based on prudential regulatory capital measures that are likely to capture some, but not all, of the risks faced by the investors.
Banks are also regulated such that they have to hold a certain amount of equity for prudential purposes as a buffer against failure. The precise amounts have been calibrated by the international regulatory community to ensure that banks are holding sufficient capital against unexpected losses in their portfolios. Risk weights are set at the product level so that unexpected losses exceed the regulated level of capital only with a pre-specified probability.
At an aggregate level, the average risk weight of a bank varies across business models due to the weight of activity that the bank conducts in each unit (mortgage lending, SME lending, etc.) and the risk weight of that unit, as prescribed by regulation. As risk weights impose minimum equity levels, they effectively regulate leverage at the asset level.6 For example, a risk weight of 1, or 100%, equates to a requirement to have an equity ratio equal to the minimum capital requirement for the bank overall (i.e. 8% under Basel III, excluding regulatory add-ons and buffers). Riskier assets typically have higher risk weights, requiring lower leverage (i.e. more equity). This in turn feeds back into the cost of equity capital for a particular asset or business unit, as the lower the leverage of the business, the lower its cost of equity capital, all else being equal.
It is to be expected that the cost of equity will vary across business units, with more risky business activities having a higher cost of equity for a given leverage. The important question is the extent to which the variation in cost of equity across business models is already accounted for by the restrictions on leverage imposed by risk-weighted assets. We can explore the answer to this question in the context of a traditional CAPM framework for asset pricing (see the box).
As the box shows, using a single hurdle rate will result in an efficient allocation of capital only if the equity betas are equal across business units. This is unrealistic for most commercial banks. For example, the risks implicit in a trading book are very different from those in the mortgage book. If there is a large variance in the equity betas of the individual segments, the approximation leads to significant misallocations of capital at the product level.
Measuring cost of equity across business models
Using the fact that the average risk weight1 at the bank level is simply the weighted average of the individual business unit risk weights, we can express the asset beta (βA) of a bank in two ways.
In terms of the bank-wide equity beta (βE):
βA = [βEw1r1 + βEw2r2 + … + βEwNrN] ⋅ 8%
In terms of the equity betas of the individual business units:
βA = [βE1w1r1 + βE2w2r2 + … + βENwNrN] ⋅ 8%
where wi is the weight of each business unit in terms of its share of the total assets of the bank, ri is the risk weight of that business unit, and βEi is the equity beta of that business unit.
While both of the above equations are correct, the accurate cost of capital at the business unit level (say, business unit i) is based on βEiw1r1.
The approach commonly used by banks is to approximate βEw1r1 to be the cost of capital for business unit i. This holds only if the bank-wide cost of equity equals the business unit cost of equity for all business units. If this is the case (i.e. if βE1 = βE2 = … = βEN = βE), there is no issue with using a single bank-wide hurdle rate.
Risk weights can reduce the variation in equity betas across business models by changing the leverage ratio of different business units. However, the variation can still exist even with perfectly calibrated risk weights, such as when a bank holds some of its portfolio as risk-free assets.
To keep the notation simple we have assumed that bank debt risk is independent of market risk—i.e. that the debt beta equals zero. However, the message does not change for a varying debt beta (proofs are available on request).
Note: 1 Risk-weighted assets divided by total assets.
Source: Oxera analysis.
Evidence—different equity betas for different activities?
To test whether betas and the cost of equity vary across banking business units, we can analyse the level of variation across banks with differing exposure to product lines.
In competitive markets, the actual return on equity achieved by an industry is expected to converge to the cost of equity (as required by investors) over the long run. Therefore, data on the return on equity may be informative about the cost of equity. The two concepts match up when the realised (accounting) returns equal the investors’ expected returns. Data from the European Banking Authority (EBA) indicates significant variation in the return on equity across European banks—at the end of 2017 the interquartile range was 3–11%, with an average of around 6% (see Figure 1). In addition to leverage and country-specific risks, part of the variation may be explained by differences in the business model that affect the exposure of investors to systematic risk.
Figure 1 Return on equity of European banks
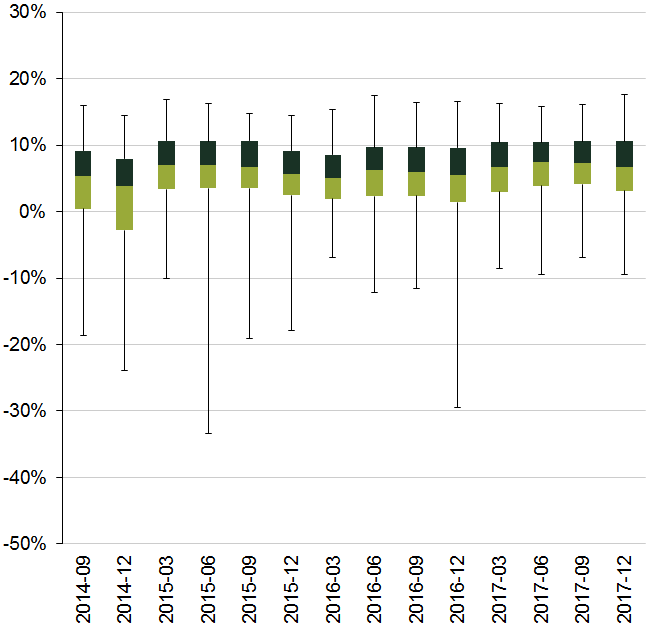
Source: EBA.
To control for leverage effects on the cost of equity, we have derived the asset betas for a sample of publicly listed European banks.7 This sample includes a wide range of business models, including universal, private, retail and investment banking-focused ones. After unlevering the equity betas with the banks’ reported leverage ratios, we can see that significant variation across business models remains (see Figure 2). For example, the interquartile range of asset betas for European banks is 0.05–0.08. This suggests that the difference in the cost of equity between banks with different business models could be in the order of around 3 percentage points.
Figure 2 Asset betas of European banks
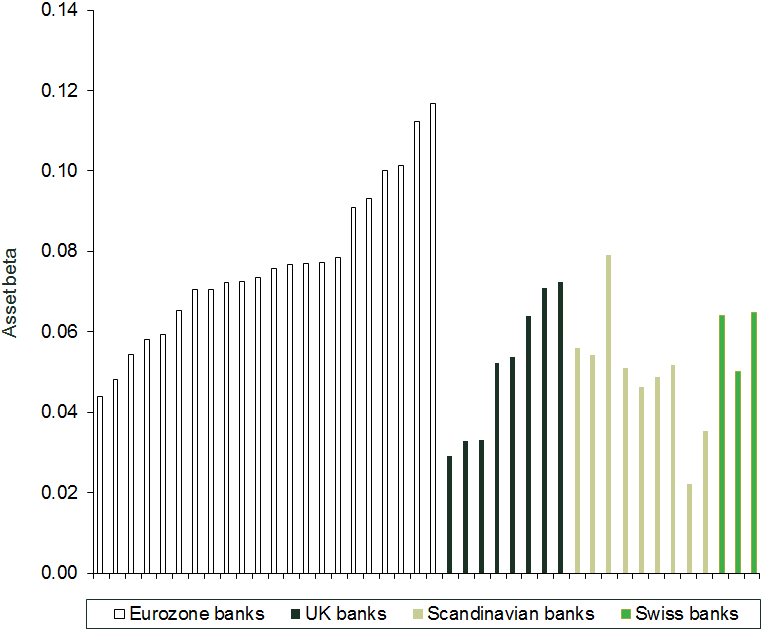
Source: Bloomberg, Oxera analysis.
Risk weights can act as a counterbalance to this variation, by imposing leverage requirements. Table 1 illustrates this point for two banks. If we (crudely) apply the average risk weight for both banks, the difference in equity betas is 0.42. If we instead use the proper risk weights, the ranking of the implied equity betas is reversed (due to the effect of leverage) and, in this case, the resulting variation between equity betas is actually larger (0.80)—i.e. the risk weights have over-compensated for the differences in asset beta. As explained above, we would not expect prudential risk weights to equalise equity betas for business units with different asset risk, as risk weights capture (subtly) different risks to the cost of equity. A natural next step in the analysis would be to control for variation in risk weights more accurately based on underlying assets at the business unit level.
Table 1 Illustrative example: effect of risk weights on equity betas
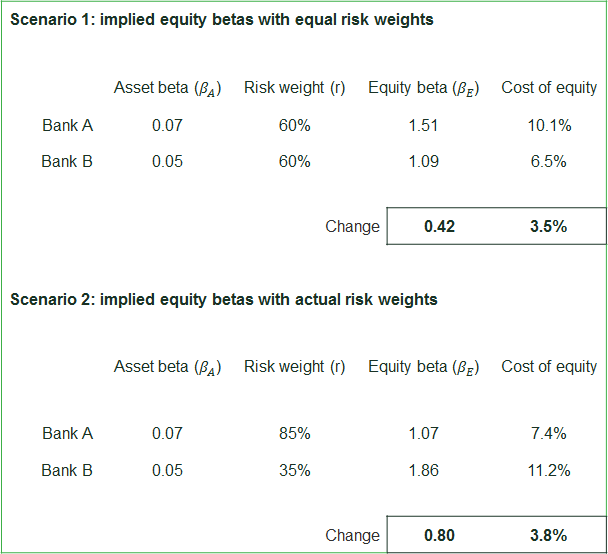
Source: Oxera analysis.
So what?
What are the consequences of using the bank-wide cost of equity to set hurdle rates at the business unit level? If banks do this, the cost of equity could diverge from the actual rate of return required to compensate for risks and generate economic profit. Incentives would be distorted, resulting in sub-optimal outcomes for bank shareholders, competitors and customers.
- For shareholders—using a single unique cost of equity can lead to significant distortions in investment decisions. For example, Krüger, Landier and Thesmar (2015)[8] highlight that using a single discount rate across an entire business can lead it to underinvest (overinvest) in relatively safe and profitable (risky and unprofitable) divisions.
- For competitors—if the bank-wide cost of equity is too low relative to the risks of a business unit, the products of this unit will be underpriced on a risk-adjusted basis, acting as a barrier to entry for competitors.
- For consumers—mispricing of product risk will lead to overcharging for some products, and undercharging for others, resulting in cross-subsidisation between customer groups.
A thorough understanding of the drivers of the cost of equity across different business units is therefore essential for maximising shareholder value, facilitating a competitive banking market with dynamic entry and exit, and achieving fair outcomes for customers.
1 European Central Bank (2016), ‘Financial Stability Review’; International Monetary Fund (2017), ‘Global Financial Stability Report 2017’.
2 Financial Conduct Authority (2018), ‘Strategic Review of Retail Banking Business Models: Progress report’, June.
3 Bank of England (2018), ‘Banks’ internal capital markets: how do banks allocate capital internally?’, Quarterly Bulletin 2018 Q2.
4 Goel, T., Lewrick, U. and Tarashev, N. (2017), ‘Bank Capital Allocation under Multiple Constraints’, BIS Working Paper No. 666, October.
5 Markowitz, H. (1952), ‘Portfolio Selection’, Journal of Finance, 7:1, pp. 77–91.
6 Financial Conduct Authority (2018), ‘Strategic Review of Retail Banking Business Models: Progress report’, June, para. 2.15.
7 By unlevering the equity betas using the banks’ reported leverage ratios, we can isolate differences across banks due to other factors, including the business model.
8 Krüger, P., Landier, A. and Thesmar, D. (2015), ‘The WACC Fallacy: The Real Effects of Using a Unique Discount Rate’, The Journal of Finance, 70:3, pp. 1253–1285.
Download

Related

Economics of the Data Act: part 1
As electronic sensors, processing power and storage have become cheaper, a growing number of connected IoT (internet of things) devices are collecting and processing data in our homes and businesses. The purpose of the EU’s Data Act is to define the rights to access and use data generated by… Read More

Adding value with a portfolio approach to funding reduction
Budgets for capital projects are coming under pressure as funding is not being maintained in real price terms. The response from portfolio managers has been to cancel or postpone future projects or slow the pace of ongoing projects. If this is undertaken on an individual project level, it could lead… Read More